Cambodian vs Immigrants from Asia Median Household Income
COMPARE
Cambodian
Immigrants from Asia
Median Household Income
Median Household Income Comparison
Cambodians
Immigrants from Asia
$96,324
MEDIAN HOUSEHOLD INCOME
99.9/ 100
METRIC RATING
48th/ 347
METRIC RANK
$99,933
MEDIAN HOUSEHOLD INCOME
100.0/ 100
METRIC RATING
29th/ 347
METRIC RANK
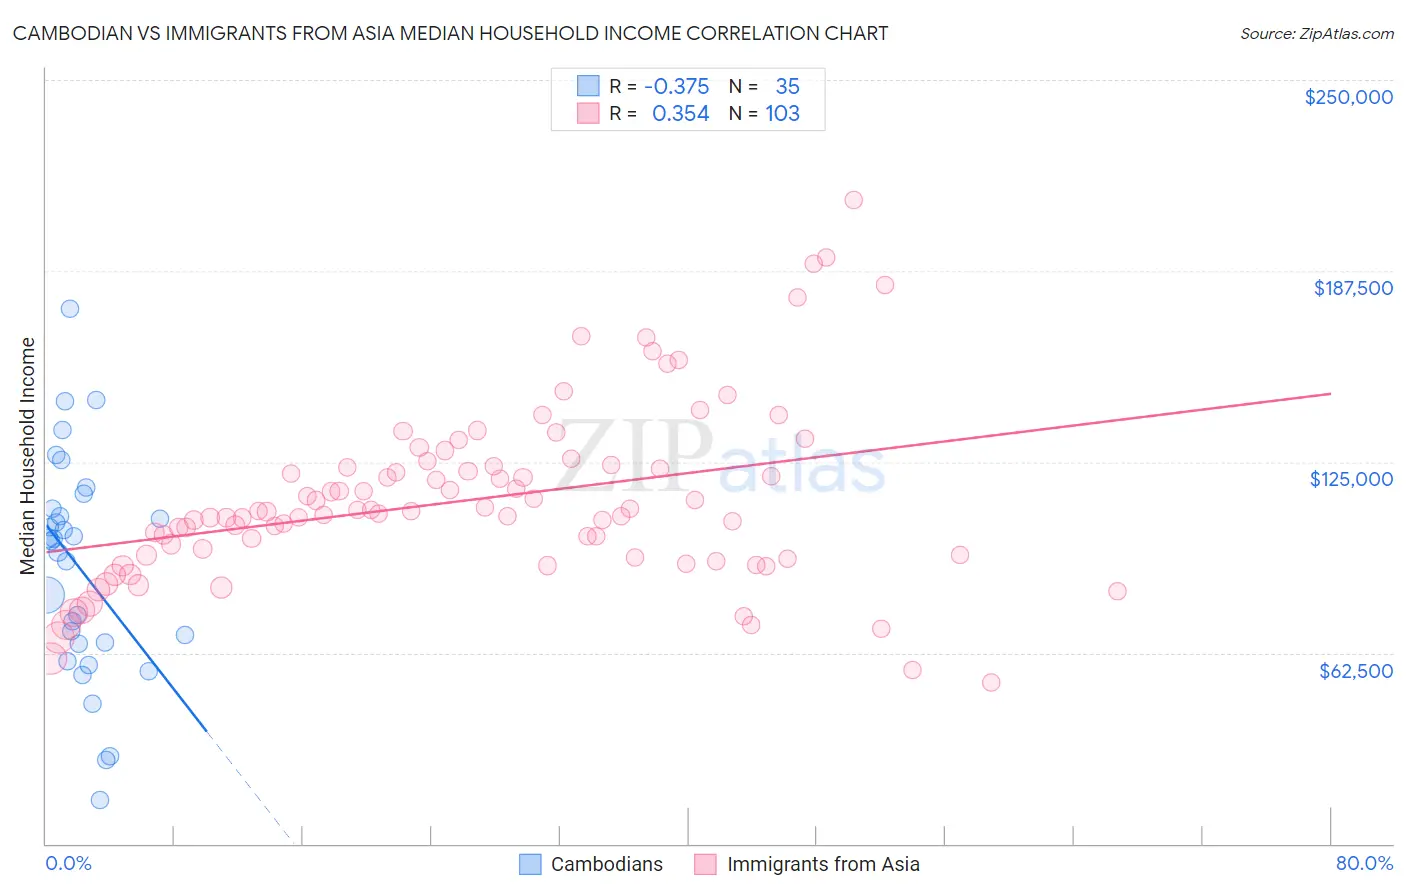
Cambodian vs Immigrants from Asia Median Household Income Correlation Chart
The statistical analysis conducted on geographies consisting of 102,460,584 people shows a mild negative correlation between the proportion of Cambodians and median household income in the United States with a correlation coefficient (R) of -0.375 and weighted average of $96,324. Similarly, the statistical analysis conducted on geographies consisting of 548,273,530 people shows a mild positive correlation between the proportion of Immigrants from Asia and median household income in the United States with a correlation coefficient (R) of 0.354 and weighted average of $99,933, a difference of 3.7%.
Median Household Income Correlation Summary
| Measurement | Cambodian | Immigrants from Asia |
| Minimum | $14,319 | $52,658 |
| Maximum | $174,929 | $210,660 |
| Range | $160,610 | $158,002 |
| Mean | $90,039 | $112,443 |
| Median | $99,162 | $108,674 |
| Interquartile 25% (IQ1) | $65,313 | $93,690 |
| Interquartile 75% (IQ3) | $109,510 | $123,452 |
| Interquartile Range (IQR) | $44,197 | $29,762 |
| Standard Deviation (Sample) | $35,802 | $28,979 |
| Standard Deviation (Population) | $35,287 | $28,838 |
Demographics Similar to Cambodians and Immigrants from Asia by Median Household Income
In terms of median household income, the demographic groups most similar to Cambodians are Immigrants from Russia ($96,378, a difference of 0.060%), Australian ($96,490, a difference of 0.17%), Israeli ($96,552, a difference of 0.24%), Immigrants from Greece ($96,675, a difference of 0.36%), and Immigrants from France ($96,743, a difference of 0.44%). Similarly, the demographic groups most similar to Immigrants from Asia are Immigrants from Sri Lanka ($99,943, a difference of 0.010%), Immigrants from Northern Europe ($99,813, a difference of 0.12%), Turkish ($99,389, a difference of 0.55%), Immigrants from Denmark ($98,510, a difference of 1.4%), and Chinese ($98,496, a difference of 1.5%).
| Demographics | Rating | Rank | Median Household Income |
| Immigrants | Sri Lanka | 100.0 /100 | #28 | Exceptional $99,943 |
| Immigrants | Asia | 100.0 /100 | #29 | Exceptional $99,933 |
| Immigrants | Northern Europe | 100.0 /100 | #30 | Exceptional $99,813 |
| Turks | 100.0 /100 | #31 | Exceptional $99,389 |
| Immigrants | Denmark | 100.0 /100 | #32 | Exceptional $98,510 |
| Chinese | 100.0 /100 | #33 | Exceptional $98,496 |
| Russians | 100.0 /100 | #34 | Exceptional $98,008 |
| Immigrants | Switzerland | 100.0 /100 | #35 | Exceptional $97,979 |
| Immigrants | Pakistan | 100.0 /100 | #36 | Exceptional $97,528 |
| Latvians | 100.0 /100 | #37 | Exceptional $97,311 |
| Immigrants | Indonesia | 100.0 /100 | #38 | Exceptional $97,297 |
| Afghans | 100.0 /100 | #39 | Exceptional $97,026 |
| Maltese | 100.0 /100 | #40 | Exceptional $97,015 |
| Immigrants | Turkey | 100.0 /100 | #41 | Exceptional $96,964 |
| Immigrants | Lithuania | 99.9 /100 | #42 | Exceptional $96,836 |
| Immigrants | France | 99.9 /100 | #43 | Exceptional $96,743 |
| Immigrants | Greece | 99.9 /100 | #44 | Exceptional $96,675 |
| Israelis | 99.9 /100 | #45 | Exceptional $96,552 |
| Australians | 99.9 /100 | #46 | Exceptional $96,490 |
| Immigrants | Russia | 99.9 /100 | #47 | Exceptional $96,378 |
| Cambodians | 99.9 /100 | #48 | Exceptional $96,324 |