Cambodian vs Immigrants from Canada Ambulatory Disability
COMPARE
Cambodian
Immigrants from Canada
Ambulatory Disability
Ambulatory Disability Comparison
Cambodians
Immigrants from Canada
5.4%
AMBULATORY DISABILITY
100.0/ 100
METRIC RATING
28th/ 347
METRIC RANK
6.1%
AMBULATORY DISABILITY
50.0/ 100
METRIC RATING
174th/ 347
METRIC RANK
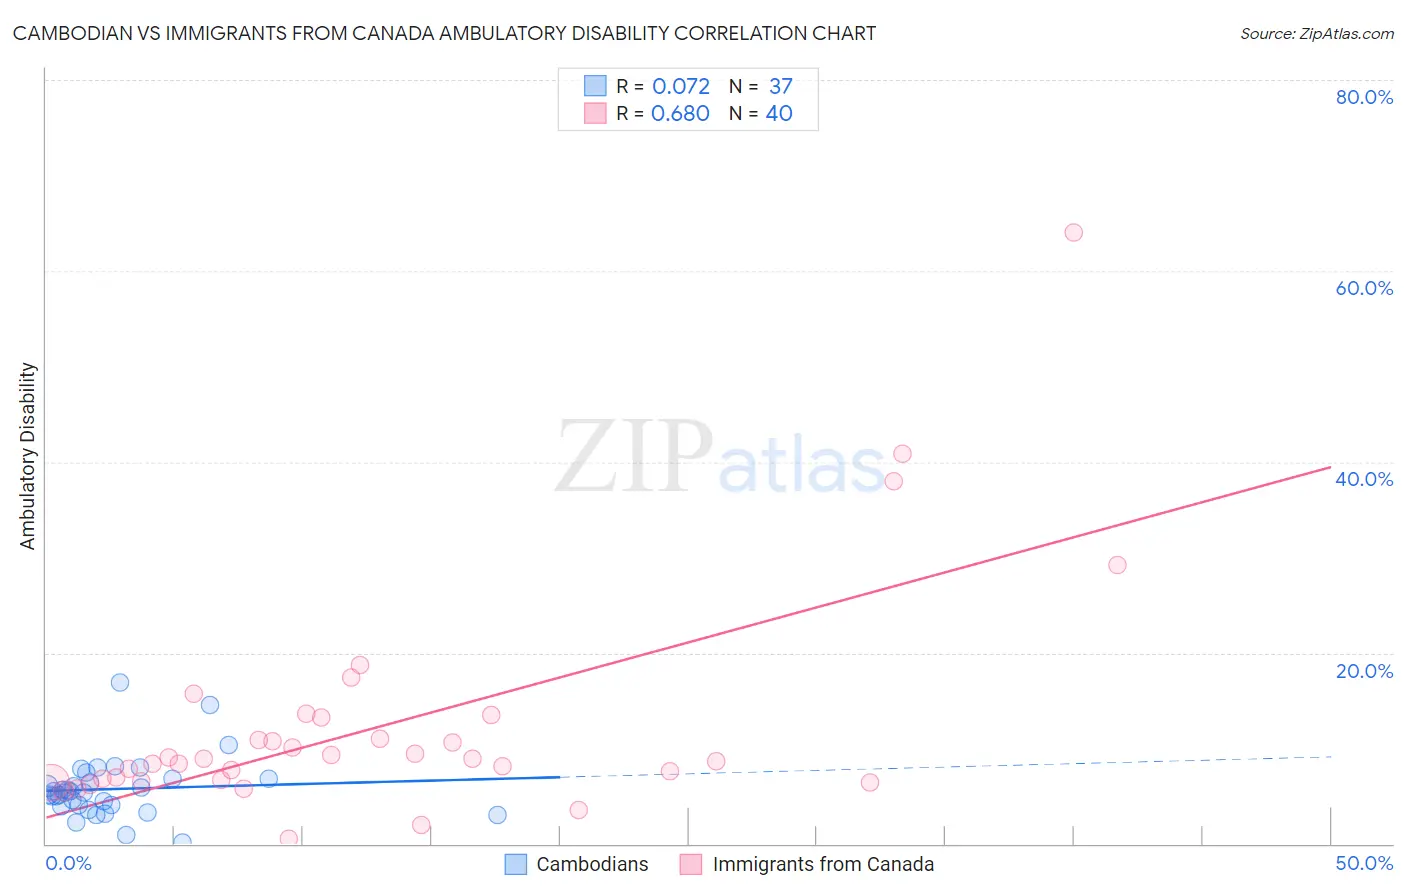
Cambodian vs Immigrants from Canada Ambulatory Disability Correlation Chart
The statistical analysis conducted on geographies consisting of 102,504,705 people shows a slight positive correlation between the proportion of Cambodians and percentage of population with ambulatory disability in the United States with a correlation coefficient (R) of 0.072 and weighted average of 5.4%. Similarly, the statistical analysis conducted on geographies consisting of 459,245,879 people shows a significant positive correlation between the proportion of Immigrants from Canada and percentage of population with ambulatory disability in the United States with a correlation coefficient (R) of 0.680 and weighted average of 6.1%, a difference of 13.1%.
Ambulatory Disability Correlation Summary
| Measurement | Cambodian | Immigrants from Canada |
| Minimum | 0.17% | 0.55% |
| Maximum | 16.9% | 64.0% |
| Range | 16.7% | 63.4% |
| Mean | 5.7% | 12.2% |
| Median | 5.4% | 8.8% |
| Interquartile 25% (IQ1) | 4.0% | 6.6% |
| Interquartile 75% (IQ3) | 6.9% | 12.1% |
| Interquartile Range (IQR) | 2.9% | 5.5% |
| Standard Deviation (Sample) | 3.2% | 11.8% |
| Standard Deviation (Population) | 3.1% | 11.6% |
Similar Demographics by Ambulatory Disability
Demographics Similar to Cambodians by Ambulatory Disability
In terms of ambulatory disability, the demographic groups most similar to Cambodians are Asian (5.4%, a difference of 0.060%), Immigrants from Iran (5.4%, a difference of 0.10%), Immigrants from Nepal (5.4%, a difference of 0.22%), Zimbabwean (5.4%, a difference of 0.25%), and Immigrants from Saudi Arabia (5.4%, a difference of 0.33%).
| Demographics | Rating | Rank | Ambulatory Disability |
| Immigrants | Kuwait | 100.0 /100 | #21 | Exceptional 5.4% |
| Immigrants | Israel | 100.0 /100 | #22 | Exceptional 5.4% |
| Tongans | 100.0 /100 | #23 | Exceptional 5.4% |
| Immigrants | Saudi Arabia | 100.0 /100 | #24 | Exceptional 5.4% |
| Zimbabweans | 100.0 /100 | #25 | Exceptional 5.4% |
| Immigrants | Nepal | 100.0 /100 | #26 | Exceptional 5.4% |
| Asians | 100.0 /100 | #27 | Exceptional 5.4% |
| Cambodians | 100.0 /100 | #28 | Exceptional 5.4% |
| Immigrants | Iran | 100.0 /100 | #29 | Exceptional 5.4% |
| Immigrants | Turkey | 100.0 /100 | #30 | Exceptional 5.4% |
| Immigrants | Venezuela | 100.0 /100 | #31 | Exceptional 5.4% |
| Immigrants | Australia | 100.0 /100 | #32 | Exceptional 5.5% |
| Immigrants | Pakistan | 100.0 /100 | #33 | Exceptional 5.5% |
| Immigrants | Asia | 100.0 /100 | #34 | Exceptional 5.5% |
| Afghans | 100.0 /100 | #35 | Exceptional 5.5% |
Demographics Similar to Immigrants from Canada by Ambulatory Disability
In terms of ambulatory disability, the demographic groups most similar to Immigrants from Canada are Croatian (6.1%, a difference of 0.060%), Immigrants from Burma/Myanmar (6.1%, a difference of 0.11%), Moroccan (6.1%, a difference of 0.14%), Vietnamese (6.1%, a difference of 0.15%), and Immigrants from Ecuador (6.1%, a difference of 0.20%).
| Demographics | Rating | Rank | Ambulatory Disability |
| Immigrants | Oceania | 60.7 /100 | #167 | Good 6.1% |
| Ecuadorians | 60.5 /100 | #168 | Good 6.1% |
| Immigrants | Southern Europe | 58.1 /100 | #169 | Average 6.1% |
| Immigrants | Ecuador | 53.8 /100 | #170 | Average 6.1% |
| Moroccans | 52.6 /100 | #171 | Average 6.1% |
| Immigrants | Burma/Myanmar | 52.2 /100 | #172 | Average 6.1% |
| Croatians | 51.2 /100 | #173 | Average 6.1% |
| Immigrants | Canada | 50.0 /100 | #174 | Average 6.1% |
| Vietnamese | 47.2 /100 | #175 | Average 6.1% |
| Immigrants | North America | 45.6 /100 | #176 | Average 6.1% |
| Immigrants | England | 45.4 /100 | #177 | Average 6.1% |
| Scandinavians | 44.5 /100 | #178 | Average 6.1% |
| Austrians | 44.1 /100 | #179 | Average 6.1% |
| Immigrants | Nicaragua | 43.9 /100 | #180 | Average 6.1% |
| Swiss | 43.1 /100 | #181 | Average 6.1% |