Cambodian vs Immigrants from Canada Disability Age Under 5
COMPARE
Cambodian
Immigrants from Canada
Disability Age Under 5
Disability Age Under 5 Comparison
Cambodians
Immigrants from Canada
1.2%
DISABILITY AGE UNDER 5
95.4/ 100
METRIC RATING
106th/ 347
METRIC RANK
1.4%
DISABILITY AGE UNDER 5
0.1/ 100
METRIC RATING
271st/ 347
METRIC RANK
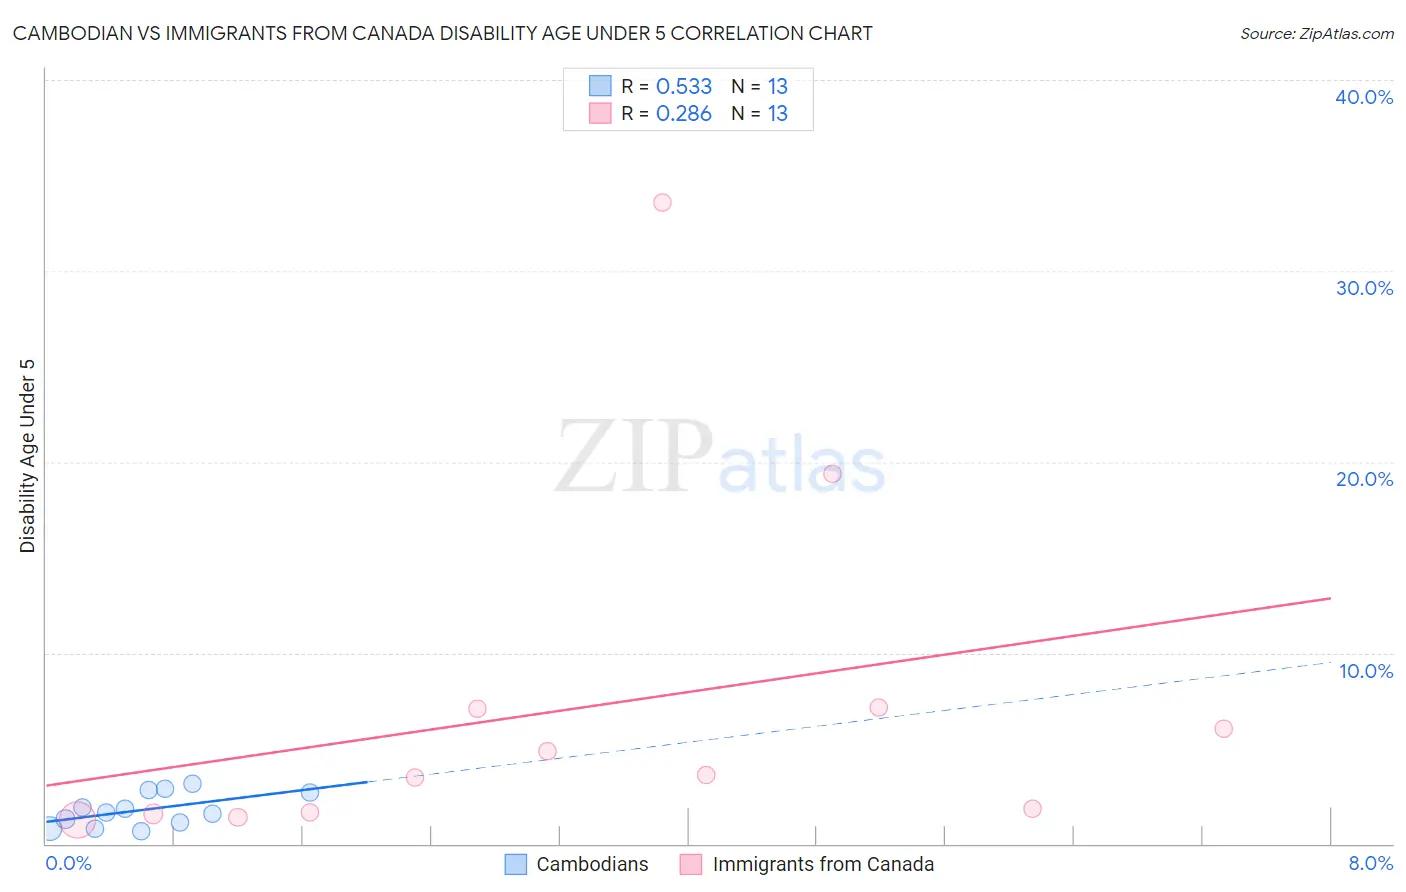
Cambodian vs Immigrants from Canada Disability Age Under 5 Correlation Chart
The statistical analysis conducted on geographies consisting of 77,498,292 people shows a substantial positive correlation between the proportion of Cambodians and percentage of population with a disability under the age of 5 in the United States with a correlation coefficient (R) of 0.533 and weighted average of 1.2%. Similarly, the statistical analysis conducted on geographies consisting of 233,728,929 people shows a weak positive correlation between the proportion of Immigrants from Canada and percentage of population with a disability under the age of 5 in the United States with a correlation coefficient (R) of 0.286 and weighted average of 1.4%, a difference of 25.0%.
Disability Age Under 5 Correlation Summary
| Measurement | Cambodian | Immigrants from Canada |
| Minimum | 0.67% | 1.3% |
| Maximum | 3.1% | 33.6% |
| Range | 2.4% | 32.3% |
| Mean | 1.8% | 7.1% |
| Median | 1.6% | 3.6% |
| Interquartile 25% (IQ1) | 0.96% | 1.6% |
| Interquartile 75% (IQ3) | 2.8% | 7.1% |
| Interquartile Range (IQR) | 1.8% | 5.5% |
| Standard Deviation (Sample) | 0.86% | 9.3% |
| Standard Deviation (Population) | 0.82% | 8.9% |
Similar Demographics by Disability Age Under 5
Demographics Similar to Cambodians by Disability Age Under 5
In terms of disability age under 5, the demographic groups most similar to Cambodians are Immigrants from West Indies (1.2%, a difference of 0.040%), Immigrants from South Africa (1.2%, a difference of 0.10%), Iraqi (1.2%, a difference of 0.17%), Immigrants from Panama (1.2%, a difference of 0.19%), and Immigrants from Lebanon (1.2%, a difference of 0.21%).
| Demographics | Rating | Rank | Disability Age Under 5 |
| Dominicans | 96.3 /100 | #99 | Exceptional 1.1% |
| Nicaraguans | 96.3 /100 | #100 | Exceptional 1.1% |
| Immigrants | Uganda | 96.1 /100 | #101 | Exceptional 1.1% |
| Immigrants | Morocco | 96.0 /100 | #102 | Exceptional 1.2% |
| Immigrants | Nicaragua | 96.0 /100 | #103 | Exceptional 1.2% |
| Indonesians | 95.9 /100 | #104 | Exceptional 1.2% |
| Immigrants | South Africa | 95.6 /100 | #105 | Exceptional 1.2% |
| Cambodians | 95.4 /100 | #106 | Exceptional 1.2% |
| Immigrants | West Indies | 95.3 /100 | #107 | Exceptional 1.2% |
| Iraqis | 95.1 /100 | #108 | Exceptional 1.2% |
| Immigrants | Panama | 95.0 /100 | #109 | Exceptional 1.2% |
| Immigrants | Lebanon | 95.0 /100 | #110 | Exceptional 1.2% |
| Senegalese | 94.6 /100 | #111 | Exceptional 1.2% |
| Immigrants | Australia | 94.4 /100 | #112 | Exceptional 1.2% |
| Immigrants | Oceania | 94.2 /100 | #113 | Exceptional 1.2% |
Demographics Similar to Immigrants from Canada by Disability Age Under 5
In terms of disability age under 5, the demographic groups most similar to Immigrants from Canada are Immigrants from North America (1.4%, a difference of 0.040%), Black/African American (1.4%, a difference of 0.16%), Austrian (1.4%, a difference of 0.17%), Belgian (1.4%, a difference of 0.35%), and Alaskan Athabascan (1.5%, a difference of 0.46%).
| Demographics | Rating | Rank | Disability Age Under 5 |
| Yugoslavians | 0.1 /100 | #264 | Tragic 1.4% |
| Carpatho Rusyns | 0.1 /100 | #265 | Tragic 1.4% |
| Immigrants | Germany | 0.1 /100 | #266 | Tragic 1.4% |
| Cree | 0.1 /100 | #267 | Tragic 1.4% |
| Belgians | 0.1 /100 | #268 | Tragic 1.4% |
| Austrians | 0.1 /100 | #269 | Tragic 1.4% |
| Immigrants | North America | 0.1 /100 | #270 | Tragic 1.4% |
| Immigrants | Canada | 0.1 /100 | #271 | Tragic 1.4% |
| Blacks/African Americans | 0.1 /100 | #272 | Tragic 1.4% |
| Alaskan Athabascans | 0.1 /100 | #273 | Tragic 1.5% |
| Iroquois | 0.0 /100 | #274 | Tragic 1.5% |
| Brazilians | 0.0 /100 | #275 | Tragic 1.5% |
| Greeks | 0.0 /100 | #276 | Tragic 1.5% |
| Canadians | 0.0 /100 | #277 | Tragic 1.5% |
| Kiowa | 0.0 /100 | #278 | Tragic 1.5% |