Puget Sound Salish vs Hispanic or Latino Median Family Income
COMPARE
Puget Sound Salish
Hispanic or Latino
Median Family Income
Median Family Income Comparison
Puget Sound Salish
Hispanics or Latinos
$97,958
MEDIAN FAMILY INCOME
8.2/ 100
METRIC RATING
210th/ 347
METRIC RANK
$85,647
MEDIAN FAMILY INCOME
0.0/ 100
METRIC RATING
303rd/ 347
METRIC RANK
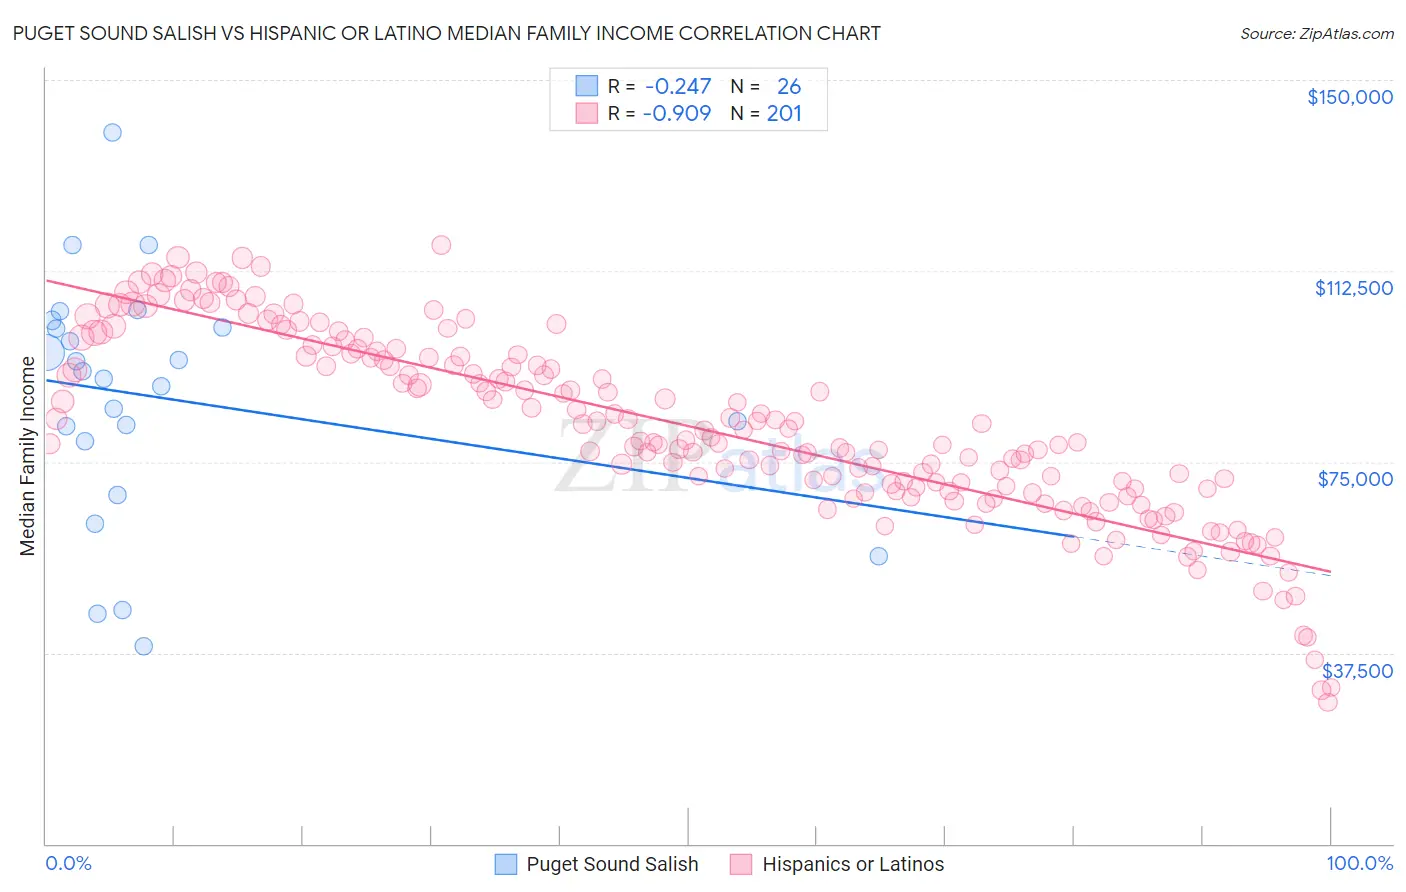
Puget Sound Salish vs Hispanic or Latino Median Family Income Correlation Chart
The statistical analysis conducted on geographies consisting of 46,154,605 people shows a weak negative correlation between the proportion of Puget Sound Salish and median family income in the United States with a correlation coefficient (R) of -0.247 and weighted average of $97,958. Similarly, the statistical analysis conducted on geographies consisting of 576,861,643 people shows a near-perfect negative correlation between the proportion of Hispanics or Latinos and median family income in the United States with a correlation coefficient (R) of -0.909 and weighted average of $85,647, a difference of 14.4%.
Median Family Income Correlation Summary
| Measurement | Puget Sound Salish | Hispanic or Latino |
| Minimum | $38,786 | $27,753 |
| Maximum | $139,583 | $117,566 |
| Range | $100,797 | $89,813 |
| Mean | $87,625 | $81,882 |
| Median | $92,122 | $79,837 |
| Interquartile 25% (IQ1) | $79,101 | $69,539 |
| Interquartile 75% (IQ3) | $101,382 | $96,180 |
| Interquartile Range (IQR) | $22,281 | $26,641 |
| Standard Deviation (Sample) | $23,723 | $18,312 |
| Standard Deviation (Population) | $23,263 | $18,267 |
Similar Demographics by Median Family Income
Demographics Similar to Puget Sound Salish by Median Family Income
In terms of median family income, the demographic groups most similar to Puget Sound Salish are Immigrants from Colombia ($98,067, a difference of 0.11%), Immigrants from Sudan ($97,737, a difference of 0.23%), Immigrants from Uruguay ($98,205, a difference of 0.25%), Panamanian ($97,683, a difference of 0.28%), and Immigrants from Armenia ($97,605, a difference of 0.36%).
| Demographics | Rating | Rank | Median Family Income |
| Scotch-Irish | 17.1 /100 | #203 | Poor $99,591 |
| Ghanaians | 12.6 /100 | #204 | Poor $98,877 |
| Hawaiians | 12.5 /100 | #205 | Poor $98,869 |
| Immigrants | Iraq | 12.1 /100 | #206 | Poor $98,786 |
| Aleuts | 11.6 /100 | #207 | Poor $98,702 |
| Immigrants | Uruguay | 9.2 /100 | #208 | Tragic $98,205 |
| Immigrants | Colombia | 8.7 /100 | #209 | Tragic $98,067 |
| Puget Sound Salish | 8.2 /100 | #210 | Tragic $97,958 |
| Immigrants | Sudan | 7.4 /100 | #211 | Tragic $97,737 |
| Panamanians | 7.2 /100 | #212 | Tragic $97,683 |
| Immigrants | Armenia | 7.0 /100 | #213 | Tragic $97,605 |
| Bermudans | 6.9 /100 | #214 | Tragic $97,577 |
| Nigerians | 6.7 /100 | #215 | Tragic $97,522 |
| Immigrants | Bosnia and Herzegovina | 6.4 /100 | #216 | Tragic $97,432 |
| Japanese | 6.0 /100 | #217 | Tragic $97,288 |
Demographics Similar to Hispanics or Latinos by Median Family Income
In terms of median family income, the demographic groups most similar to Hispanics or Latinos are Mexican ($85,618, a difference of 0.030%), Spanish American Indian ($85,728, a difference of 0.090%), Colville ($85,792, a difference of 0.17%), Paiute ($85,414, a difference of 0.27%), and Immigrants from Dominica ($85,411, a difference of 0.28%).
| Demographics | Rating | Rank | Median Family Income |
| Immigrants | Guatemala | 0.0 /100 | #296 | Tragic $87,191 |
| Cajuns | 0.0 /100 | #297 | Tragic $87,157 |
| Immigrants | Latin America | 0.0 /100 | #298 | Tragic $86,989 |
| Chippewa | 0.0 /100 | #299 | Tragic $86,852 |
| Ottawa | 0.0 /100 | #300 | Tragic $86,380 |
| Colville | 0.0 /100 | #301 | Tragic $85,792 |
| Spanish American Indians | 0.0 /100 | #302 | Tragic $85,728 |
| Hispanics or Latinos | 0.0 /100 | #303 | Tragic $85,647 |
| Mexicans | 0.0 /100 | #304 | Tragic $85,618 |
| Paiute | 0.0 /100 | #305 | Tragic $85,414 |
| Immigrants | Dominica | 0.0 /100 | #306 | Tragic $85,411 |
| Chickasaw | 0.0 /100 | #307 | Tragic $85,356 |
| U.S. Virgin Islanders | 0.0 /100 | #308 | Tragic $85,294 |
| Haitians | 0.0 /100 | #309 | Tragic $85,218 |
| Immigrants | Central America | 0.0 /100 | #310 | Tragic $85,050 |