Crow vs Hispanic or Latino Median Family Income
COMPARE
Crow
Hispanic or Latino
Median Family Income
Median Family Income Comparison
Crow
Hispanics or Latinos
$76,605
MEDIAN FAMILY INCOME
0.0/ 100
METRIC RATING
342nd/ 347
METRIC RANK
$85,647
MEDIAN FAMILY INCOME
0.0/ 100
METRIC RATING
303rd/ 347
METRIC RANK
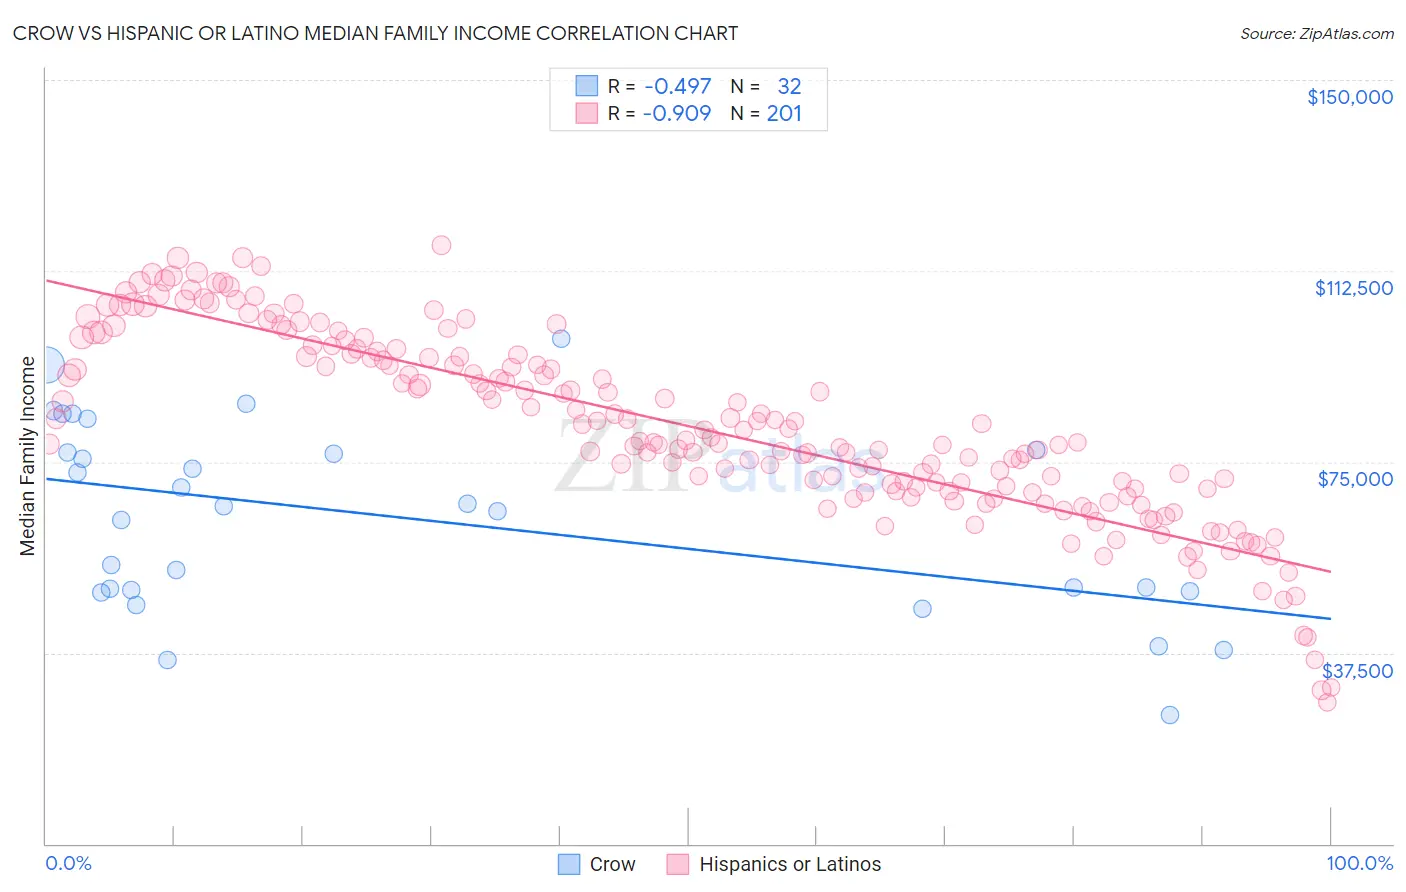
Crow vs Hispanic or Latino Median Family Income Correlation Chart
The statistical analysis conducted on geographies consisting of 59,195,543 people shows a moderate negative correlation between the proportion of Crow and median family income in the United States with a correlation coefficient (R) of -0.497 and weighted average of $76,605. Similarly, the statistical analysis conducted on geographies consisting of 576,861,643 people shows a near-perfect negative correlation between the proportion of Hispanics or Latinos and median family income in the United States with a correlation coefficient (R) of -0.909 and weighted average of $85,647, a difference of 11.8%.
Median Family Income Correlation Summary
| Measurement | Crow | Hispanic or Latino |
| Minimum | $25,179 | $27,753 |
| Maximum | $99,219 | $117,566 |
| Range | $74,040 | $89,813 |
| Mean | $63,807 | $81,882 |
| Median | $65,747 | $79,837 |
| Interquartile 25% (IQ1) | $49,683 | $69,539 |
| Interquartile 75% (IQ3) | $77,098 | $96,180 |
| Interquartile Range (IQR) | $27,414 | $26,641 |
| Standard Deviation (Sample) | $18,632 | $18,312 |
| Standard Deviation (Population) | $18,339 | $18,267 |
Similar Demographics by Median Family Income
Demographics Similar to Crow by Median Family Income
In terms of median family income, the demographic groups most similar to Crow are Pueblo ($76,880, a difference of 0.36%), Houma ($76,188, a difference of 0.55%), Hopi ($77,188, a difference of 0.76%), Pima ($77,431, a difference of 1.1%), and Immigrants from Yemen ($77,457, a difference of 1.1%).
| Demographics | Rating | Rank | Median Family Income |
| Kiowa | 0.0 /100 | #333 | Tragic $80,885 |
| Menominee | 0.0 /100 | #334 | Tragic $79,563 |
| Yup'ik | 0.0 /100 | #335 | Tragic $79,290 |
| Immigrants | Cuba | 0.0 /100 | #336 | Tragic $78,249 |
| Yuman | 0.0 /100 | #337 | Tragic $78,055 |
| Immigrants | Yemen | 0.0 /100 | #338 | Tragic $77,457 |
| Pima | 0.0 /100 | #339 | Tragic $77,431 |
| Hopi | 0.0 /100 | #340 | Tragic $77,188 |
| Pueblo | 0.0 /100 | #341 | Tragic $76,880 |
| Crow | 0.0 /100 | #342 | Tragic $76,605 |
| Houma | 0.0 /100 | #343 | Tragic $76,188 |
| Tohono O'odham | 0.0 /100 | #344 | Tragic $72,193 |
| Navajo | 0.0 /100 | #345 | Tragic $70,989 |
| Puerto Ricans | 0.0 /100 | #346 | Tragic $70,423 |
| Lumbee | 0.0 /100 | #347 | Tragic $68,679 |
Demographics Similar to Hispanics or Latinos by Median Family Income
In terms of median family income, the demographic groups most similar to Hispanics or Latinos are Mexican ($85,618, a difference of 0.030%), Spanish American Indian ($85,728, a difference of 0.090%), Colville ($85,792, a difference of 0.17%), Paiute ($85,414, a difference of 0.27%), and Immigrants from Dominica ($85,411, a difference of 0.28%).
| Demographics | Rating | Rank | Median Family Income |
| Immigrants | Guatemala | 0.0 /100 | #296 | Tragic $87,191 |
| Cajuns | 0.0 /100 | #297 | Tragic $87,157 |
| Immigrants | Latin America | 0.0 /100 | #298 | Tragic $86,989 |
| Chippewa | 0.0 /100 | #299 | Tragic $86,852 |
| Ottawa | 0.0 /100 | #300 | Tragic $86,380 |
| Colville | 0.0 /100 | #301 | Tragic $85,792 |
| Spanish American Indians | 0.0 /100 | #302 | Tragic $85,728 |
| Hispanics or Latinos | 0.0 /100 | #303 | Tragic $85,647 |
| Mexicans | 0.0 /100 | #304 | Tragic $85,618 |
| Paiute | 0.0 /100 | #305 | Tragic $85,414 |
| Immigrants | Dominica | 0.0 /100 | #306 | Tragic $85,411 |
| Chickasaw | 0.0 /100 | #307 | Tragic $85,356 |
| U.S. Virgin Islanders | 0.0 /100 | #308 | Tragic $85,294 |
| Haitians | 0.0 /100 | #309 | Tragic $85,218 |
| Immigrants | Central America | 0.0 /100 | #310 | Tragic $85,050 |