Ukrainian vs Hispanic or Latino Median Family Income
COMPARE
Ukrainian
Hispanic or Latino
Median Family Income
Median Family Income Comparison
Ukrainians
Hispanics or Latinos
$111,368
MEDIAN FAMILY INCOME
98.8/ 100
METRIC RATING
86th/ 347
METRIC RANK
$85,647
MEDIAN FAMILY INCOME
0.0/ 100
METRIC RATING
303rd/ 347
METRIC RANK
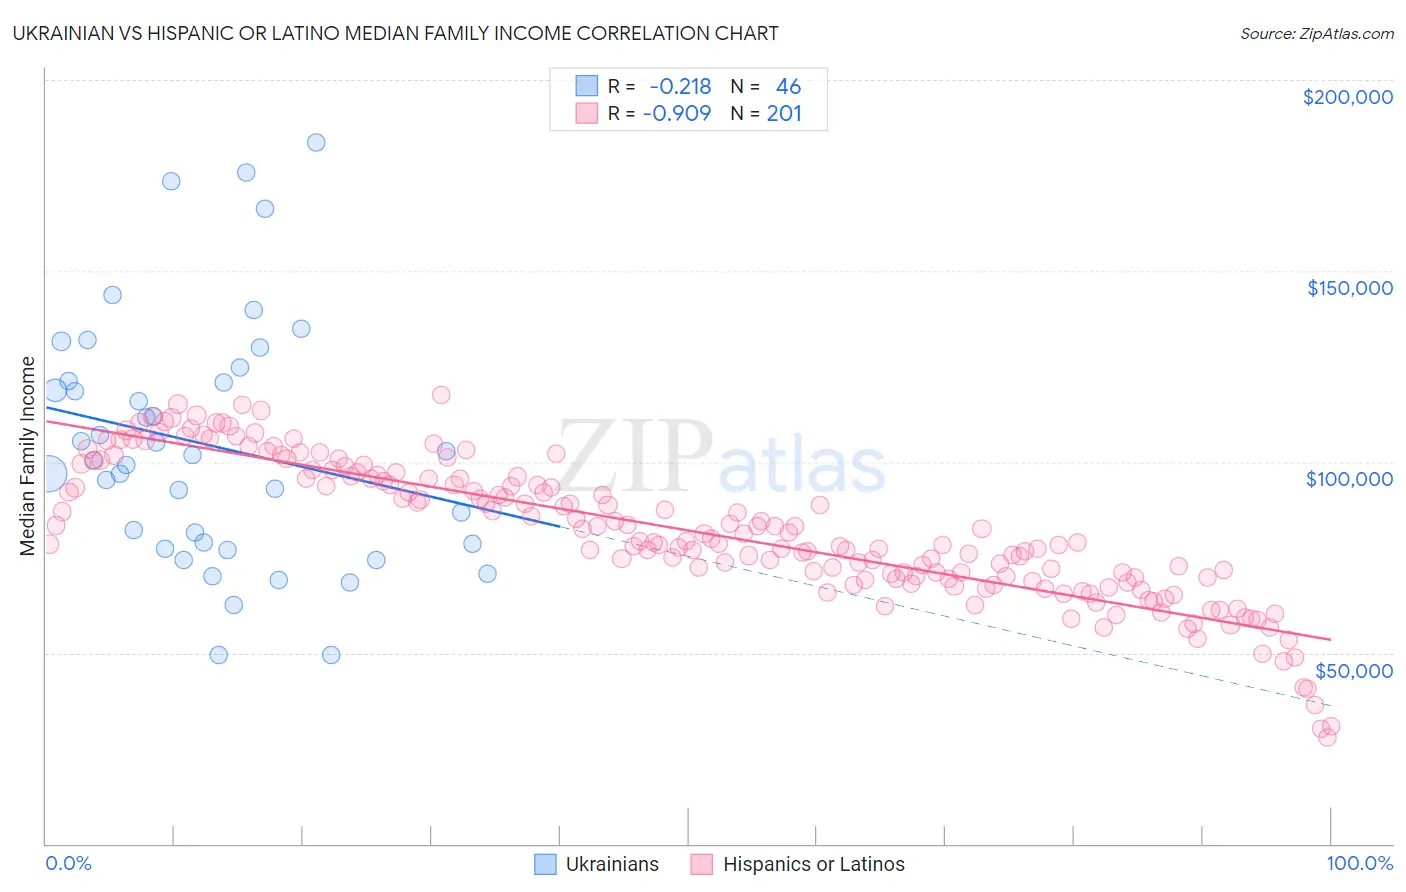
Ukrainian vs Hispanic or Latino Median Family Income Correlation Chart
The statistical analysis conducted on geographies consisting of 448,126,657 people shows a weak negative correlation between the proportion of Ukrainians and median family income in the United States with a correlation coefficient (R) of -0.218 and weighted average of $111,368. Similarly, the statistical analysis conducted on geographies consisting of 576,861,643 people shows a near-perfect negative correlation between the proportion of Hispanics or Latinos and median family income in the United States with a correlation coefficient (R) of -0.909 and weighted average of $85,647, a difference of 30.0%.
Median Family Income Correlation Summary
| Measurement | Ukrainian | Hispanic or Latino |
| Minimum | $49,418 | $27,753 |
| Maximum | $183,477 | $117,566 |
| Range | $134,059 | $89,813 |
| Mean | $104,354 | $81,882 |
| Median | $101,148 | $79,837 |
| Interquartile 25% (IQ1) | $78,581 | $69,539 |
| Interquartile 75% (IQ3) | $121,262 | $96,180 |
| Interquartile Range (IQR) | $42,681 | $26,641 |
| Standard Deviation (Sample) | $32,156 | $18,312 |
| Standard Deviation (Population) | $31,804 | $18,267 |
Similar Demographics by Median Family Income
Demographics Similar to Ukrainians by Median Family Income
In terms of median family income, the demographic groups most similar to Ukrainians are Croatian ($111,370, a difference of 0.0%), Immigrants from Hungary ($111,378, a difference of 0.010%), Austrian ($111,306, a difference of 0.060%), Romanian ($111,243, a difference of 0.11%), and Immigrants from Egypt ($111,689, a difference of 0.29%).
| Demographics | Rating | Rank | Median Family Income |
| Italians | 99.3 /100 | #79 | Exceptional $112,372 |
| Immigrants | Croatia | 99.3 /100 | #80 | Exceptional $112,323 |
| Immigrants | North America | 99.2 /100 | #81 | Exceptional $112,151 |
| Immigrants | England | 99.2 /100 | #82 | Exceptional $112,038 |
| Immigrants | Egypt | 99.0 /100 | #83 | Exceptional $111,689 |
| Immigrants | Hungary | 98.8 /100 | #84 | Exceptional $111,378 |
| Croatians | 98.8 /100 | #85 | Exceptional $111,370 |
| Ukrainians | 98.8 /100 | #86 | Exceptional $111,368 |
| Austrians | 98.8 /100 | #87 | Exceptional $111,306 |
| Romanians | 98.8 /100 | #88 | Exceptional $111,243 |
| Immigrants | Argentina | 98.5 /100 | #89 | Exceptional $110,873 |
| Northern Europeans | 98.3 /100 | #90 | Exceptional $110,635 |
| Immigrants | Southern Europe | 98.3 /100 | #91 | Exceptional $110,614 |
| Immigrants | Lebanon | 97.9 /100 | #92 | Exceptional $110,159 |
| Immigrants | Kazakhstan | 97.8 /100 | #93 | Exceptional $110,137 |
Demographics Similar to Hispanics or Latinos by Median Family Income
In terms of median family income, the demographic groups most similar to Hispanics or Latinos are Mexican ($85,618, a difference of 0.030%), Spanish American Indian ($85,728, a difference of 0.090%), Colville ($85,792, a difference of 0.17%), Paiute ($85,414, a difference of 0.27%), and Immigrants from Dominica ($85,411, a difference of 0.28%).
| Demographics | Rating | Rank | Median Family Income |
| Immigrants | Guatemala | 0.0 /100 | #296 | Tragic $87,191 |
| Cajuns | 0.0 /100 | #297 | Tragic $87,157 |
| Immigrants | Latin America | 0.0 /100 | #298 | Tragic $86,989 |
| Chippewa | 0.0 /100 | #299 | Tragic $86,852 |
| Ottawa | 0.0 /100 | #300 | Tragic $86,380 |
| Colville | 0.0 /100 | #301 | Tragic $85,792 |
| Spanish American Indians | 0.0 /100 | #302 | Tragic $85,728 |
| Hispanics or Latinos | 0.0 /100 | #303 | Tragic $85,647 |
| Mexicans | 0.0 /100 | #304 | Tragic $85,618 |
| Paiute | 0.0 /100 | #305 | Tragic $85,414 |
| Immigrants | Dominica | 0.0 /100 | #306 | Tragic $85,411 |
| Chickasaw | 0.0 /100 | #307 | Tragic $85,356 |
| U.S. Virgin Islanders | 0.0 /100 | #308 | Tragic $85,294 |
| Haitians | 0.0 /100 | #309 | Tragic $85,218 |
| Immigrants | Central America | 0.0 /100 | #310 | Tragic $85,050 |