Cajun vs Greek Median Household Income

COMPARE

Cajun
Race
Ancestry
AfghanAfricanAlaska NativeAlaskan AthabascanAlbanianAleutAlsatianAmericanApacheArabArapahoArgentineanArmenianAssyrian/Chaldean/SyriacAustralianAustrianBahamianBangladeshiBarbadianBasqueBelgianBelizeanBermudanBhutaneseBlackfeetBolivianBrazilianBritishBritish West IndianBulgarianBurmeseCajunCambodianCanadianCape VerdeanCarpatho RusynCelticCentral AmericanCentral American IndianCherokeeCheyenneChickasawChileanChineseChippewaChoctawColombianColvilleComancheCosta RicanCreeCreekCroatianCrowCubanCypriotCzechCzechoslovakianDanishDelawareDominicanDutchDutch West IndianEastern EuropeanEcuadorianEgyptianEnglishEstonianEthiopianEuropeanFijianFilipinoFinnishFrenchFrench American IndianFrench CanadianGermanGerman RussianGhanaianGuamanian/ChamorroGuatemalanGuyaneseHaitianHmongHonduranHopiHoumaHungarianIcelanderIndian (Asian)IndonesianInupiatIranianIraqiIrishIroquoisIsraeliItalianJamaicanJapaneseJordanianKenyanKiowaKoreanLaotianLatvianLebaneseLiberianLithuanianLumbeeLuxembourgerMacedonianMalaysianMalteseMarshalleseMenomineeMexicanMexican American IndianMongolianMoroccanNative HawaiianNavajoNepaleseNew ZealanderNicaraguanNigerianNorthern EuropeanNorwegianOkinawanOsageOttawaPaiutePakistaniPalestinianPanamanianParaguayanPennsylvania GermanPeruvianPimaPolishPortuguesePotawatomiPuebloPuerto RicanPuget Sound SalishRomanianRussianSalvadoranSamoanScandinavianScotch-IrishScottishSeminoleSenegaleseSerbianShoshoneSierra LeoneanSiouxSlavicSlovakSloveneSomaliSouth AfricanSouth AmericanSouth American IndianSoviet UnionSpaniardSpanishSpanish AmericanSpanish American IndianSri LankanSubsaharan AfricanSudaneseSwedishSwissSyrianTaiwaneseThaiTlingit-HaidaTohono O'OdhamTonganTrinidadian and TobagonianTsimshianTurkishU.S. Virgin IslanderUgandanUkrainianUruguayanUteVenezuelanVietnameseWelshWest IndianYakamaYaquiYugoslavianYumanYup'ikZimbabwean
Immigration
NonimmigrantsImmigrantsAfghanistanAfricaAlbaniaArgentinaArmeniaAsiaAustraliaAustriaBahamasBangladeshBarbadosBelarusBelgiumBelizeBoliviaBosnia and HerzegovinaBrazilBulgariaBurma/MyanmarCabo VerdeCambodiaCameroonCanadaCaribbeanCentral AmericaChileChinaColombiaCongoCosta RicaCroatiaCubaCzechoslovakiaDenmarkDominicaDominican RepublicEastern AfricaEastern AsiaEastern EuropeEcuadorEgyptEl SalvadorEnglandEritreaEthiopiaEuropeFijiFranceGermanyGhanaGreeceGrenadaGuatemalaGuyanaHaitiHondurasHong KongHungaryIndiaIndonesiaIranIraqIrelandIsraelItalyJamaicaJapanJordanKazakhstanKenyaKoreaKuwaitLaosLatin AmericaLatviaLebanonLiberiaLithuaniaMalaysiaMexicoMicronesiaMiddle AfricaMoldovaMoroccoNepalNetherlandsNicaraguaNigeriaNorth AmericaNorth MacedoniaNorthern AfricaNorthern EuropeNorwayOceaniaPakistanPanamaPeruPhilippinesPolandPortugalRomaniaRussiaSaudi ArabiaScotlandSenegalSerbiaSierra LeoneSingaporeSomaliaSouth AfricaSouth AmericaSouth Central AsiaSouth Eastern AsiaSouthern EuropeSpainSri LankaSt. Vincent and the GrenadinesSudanSwedenSwitzerlandSyriaTaiwanThailandTrinidad and TobagoTurkeyUgandaUkraineUruguayUzbekistanVenezuelaVietnamWest IndiesWestern AfricaWestern AsiaWestern EuropeYemenZaireZimbabweAzores
Greek
Race
Ancestry
AfghanAfricanAlaska NativeAlaskan AthabascanAlbanianAleutAlsatianAmericanApacheArabArapahoArgentineanArmenianAssyrian/Chaldean/SyriacAustralianAustrianBahamianBangladeshiBarbadianBasqueBelgianBelizeanBermudanBhutaneseBlackfeetBolivianBrazilianBritishBritish West IndianBulgarianBurmeseCambodianCanadianCape VerdeanCarpatho RusynCelticCentral AmericanCentral American IndianCherokeeCheyenneChickasawChileanChineseChippewaChoctawColombianColvilleComancheCosta RicanCreeCreekCroatianCrowCubanCypriotCzechCzechoslovakianDanishDelawareDominicanDutchDutch West IndianEastern EuropeanEcuadorianEgyptianEnglishEstonianEthiopianEuropeanFijianFilipinoFinnishFrenchFrench American IndianFrench CanadianGermanGerman RussianGhanaianGreekGuamanian/ChamorroGuatemalanGuyaneseHaitianHmongHonduranHopiHoumaHungarianIcelanderIndian (Asian)IndonesianInupiatIranianIraqiIrishIroquoisIsraeliItalianJamaicanJapaneseJordanianKenyanKiowaKoreanLaotianLatvianLebaneseLiberianLithuanianLumbeeLuxembourgerMacedonianMalaysianMalteseMarshalleseMenomineeMexicanMexican American IndianMongolianMoroccanNative HawaiianNavajoNepaleseNew ZealanderNicaraguanNigerianNorthern EuropeanNorwegianOkinawanOsageOttawaPaiutePakistaniPalestinianPanamanianParaguayanPennsylvania GermanPeruvianPimaPolishPortuguesePotawatomiPuebloPuerto RicanPuget Sound SalishRomanianRussianSalvadoranSamoanScandinavianScotch-IrishScottishSeminoleSenegaleseSerbianShoshoneSierra LeoneanSiouxSlavicSlovakSloveneSomaliSouth AfricanSouth AmericanSouth American IndianSoviet UnionSpaniardSpanishSpanish AmericanSpanish American IndianSri LankanSubsaharan AfricanSudaneseSwedishSwissSyrianTaiwaneseThaiTlingit-HaidaTohono O'OdhamTonganTrinidadian and TobagonianTsimshianTurkishU.S. Virgin IslanderUgandanUkrainianUruguayanUteVenezuelanVietnameseWelshWest IndianYakamaYaquiYugoslavianYumanYup'ikZimbabwean
Immigration
NonimmigrantsImmigrantsAfghanistanAfricaAlbaniaArgentinaArmeniaAsiaAustraliaAustriaBahamasBangladeshBarbadosBelarusBelgiumBelizeBoliviaBosnia and HerzegovinaBrazilBulgariaBurma/MyanmarCabo VerdeCambodiaCameroonCanadaCaribbeanCentral AmericaChileChinaColombiaCongoCosta RicaCroatiaCubaCzechoslovakiaDenmarkDominicaDominican RepublicEastern AfricaEastern AsiaEastern EuropeEcuadorEgyptEl SalvadorEnglandEritreaEthiopiaEuropeFijiFranceGermanyGhanaGreeceGrenadaGuatemalaGuyanaHaitiHondurasHong KongHungaryIndiaIndonesiaIranIraqIrelandIsraelItalyJamaicaJapanJordanKazakhstanKenyaKoreaKuwaitLaosLatin AmericaLatviaLebanonLiberiaLithuaniaMalaysiaMexicoMicronesiaMiddle AfricaMoldovaMoroccoNepalNetherlandsNicaraguaNigeriaNorth AmericaNorth MacedoniaNorthern AfricaNorthern EuropeNorwayOceaniaPakistanPanamaPeruPhilippinesPolandPortugalRomaniaRussiaSaudi ArabiaScotlandSenegalSerbiaSierra LeoneSingaporeSomaliaSouth AfricaSouth AmericaSouth Central AsiaSouth Eastern AsiaSouthern EuropeSpainSri LankaSt. Vincent and the GrenadinesSudanSwedenSwitzerlandSyriaTaiwanThailandTrinidad and TobagoTurkeyUgandaUkraineUruguayUzbekistanVenezuelaVietnamWest IndiesWestern AfricaWestern AsiaWestern EuropeYemenZaireZimbabweAzores
Median Household Income
Income
Poverty
Unemployment
Labor Participation
Family Structure
Vehicle Availability
Education Level
Disability

Median Household Income Comparison

Cajuns

Greeks

Tragic
Exceptional
$70,605
MEDIAN HOUSEHOLD INCOME
0.0/ 100
METRIC RATING
317th/ 347
METRIC RANK
$94,735
MEDIAN HOUSEHOLD INCOME
99.8/ 100
METRIC RATING
63rd/ 347
METRIC RANK

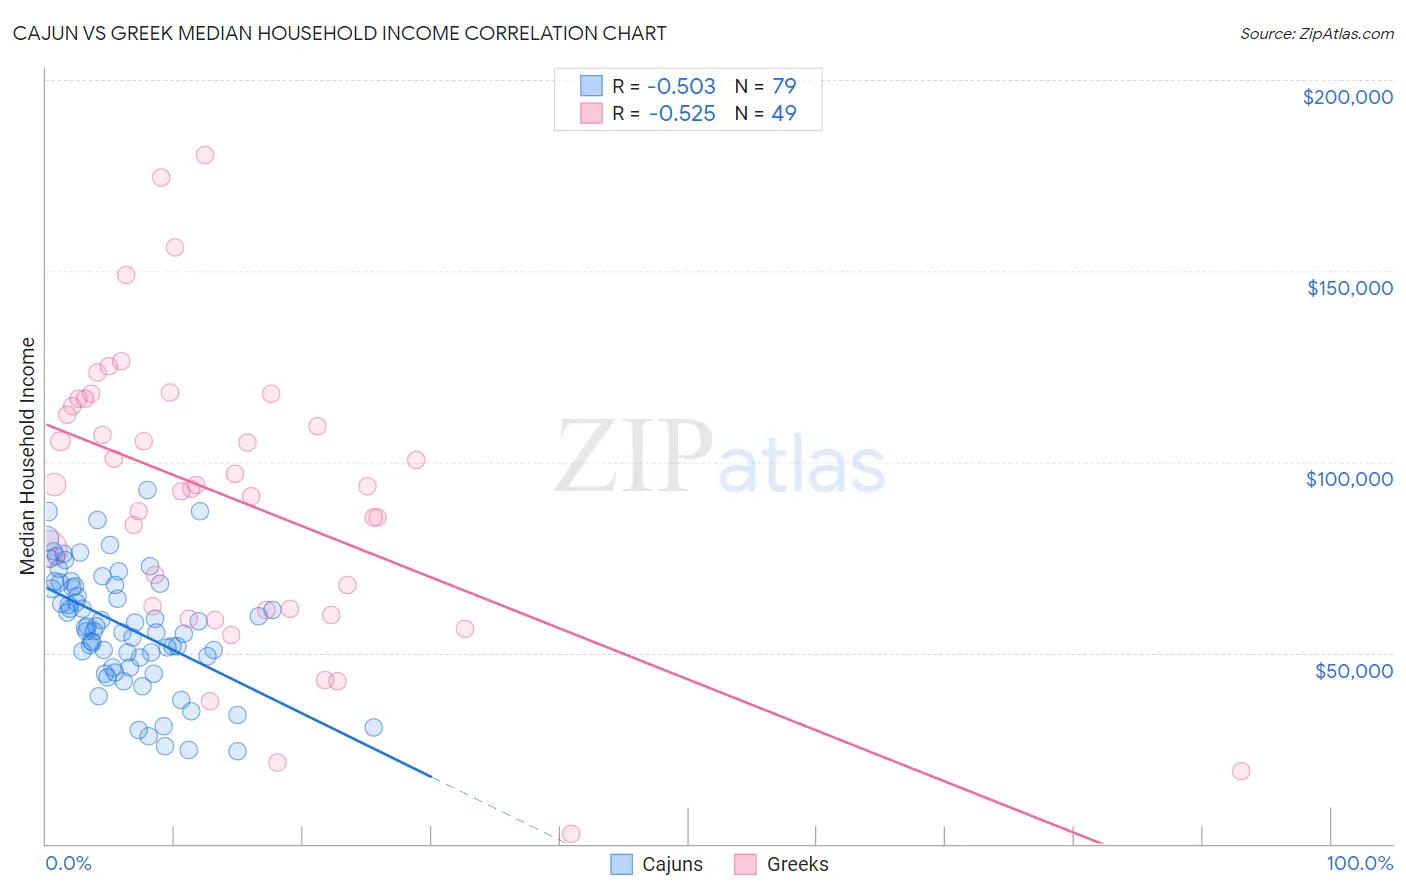
Cajun vs Greek Median Household Income Correlation Chart

The statistical analysis conducted on geographies consisting of 149,670,755 people shows a substantial negative correlation between the proportion of Cajuns and median household income in the United States with a correlation coefficient (R) of -0.503 and weighted average of $70,605. Similarly, the statistical analysis conducted on geographies consisting of 482,222,552 people shows a substantial negative correlation between the proportion of Greeks and median household income in the United States with a correlation coefficient (R) of -0.525 and weighted average of $94,735, a difference of 34.2%.
Cajun vs Greek Median Household Income

Median Household Income Correlation Summary

MeasurementCajunGreek
Minimum$24,375$2,499
Maximum$92,480$180,197
Range$68,105$177,698
Mean$57,001$90,436
Median$56,809$93,750
Interquartile 25% (IQ1)$48,865$61,372
Interquartile 75% (IQ3)$68,083$115,471
Interquartile Range (IQR)$19,218$54,098
Standard Deviation (Sample)$15,446$37,295
Standard Deviation (Population)$15,348$36,913

Similar Demographics by Median Household Income

Demographics Similar to Cajuns by Median Household Income

In terms of median household income, the demographic groups most similar to Cajuns are Chippewa ($70,539, a difference of 0.090%), Apache ($70,927, a difference of 0.46%), Ottawa ($70,984, a difference of 0.54%), Immigrants from Dominican Republic ($70,208, a difference of 0.56%), and Colville ($70,094, a difference of 0.73%).
DemographicsRating | RankMedian Household Income
U.S. Virgin Islanders
0.0
/100
|
#310
Tragic
$71,853
Immigrants | Zaire
0.0
/100
|
#311
Tragic
$71,801
Immigrants | Honduras
0.0
/100
|
#312
Tragic
$71,452
Immigrants | Bahamas
0.0
/100
|
#313
Tragic
$71,349
Dominicans
0.0
/100
|
#314
Tragic
$71,302
Ottawa
0.0
/100
|
#315
Tragic
$70,984
Apache
0.0
/100
|
#316
Tragic
$70,927
Cajuns
0.0
/100
|
#317
Tragic
$70,605
Chippewa
0.0
/100
|
#318
Tragic
$70,539
Immigrants | Dominican Republic
0.0
/100
|
#319
Tragic
$70,208
Colville
0.0
/100
|
#320
Tragic
$70,094
Chickasaw
0.0
/100
|
#321
Tragic
$70,005
Choctaw
0.0
/100
|
#322
Tragic
$69,947
Bahamians
0.0
/100
|
#323
Tragic
$69,726
Yup'ik
0.0
/100
|
#324
Tragic
$69,695

Demographics Similar to Greeks by Median Household Income

In terms of median household income, the demographic groups most similar to Greeks are Immigrants from Norway ($94,846, a difference of 0.12%), Laotian ($94,990, a difference of 0.27%), Korean ($95,018, a difference of 0.30%), Immigrants from Europe ($95,032, a difference of 0.31%), and Immigrants from Netherlands ($94,411, a difference of 0.34%).
DemographicsRating | RankMedian Household Income
Immigrants | Austria
99.9
/100
|
#56
Exceptional
$95,277
New Zealanders
99.8
/100
|
#57
Exceptional
$95,146
Soviet Union
99.8
/100
|
#58
Exceptional
$95,098
Immigrants | Europe
99.8
/100
|
#59
Exceptional
$95,032
Koreans
99.8
/100
|
#60
Exceptional
$95,018
Laotians
99.8
/100
|
#61
Exceptional
$94,990
Immigrants | Norway
99.8
/100
|
#62
Exceptional
$94,846
Greeks
99.8
/100
|
#63
Exceptional
$94,735
Immigrants | Netherlands
99.7
/100
|
#64
Exceptional
$94,411
Immigrants | Belarus
99.7
/100
|
#65
Exceptional
$94,399
Immigrants | Romania
99.7
/100
|
#66
Exceptional
$94,222
Immigrants | Scotland
99.7
/100
|
#67
Exceptional
$94,091
Mongolians
99.7
/100
|
#68
Exceptional
$93,971
Argentineans
99.7
/100
|
#69
Exceptional
$93,960
Immigrants | Fiji
99.7
/100
|
#70
Exceptional
$93,933