Cajun vs Pakistani Median Household Income
COMPARE
Cajun
Pakistani
Median Household Income
Median Household Income Comparison
Cajuns
Pakistanis
$70,605
MEDIAN HOUSEHOLD INCOME
0.0/ 100
METRIC RATING
317th/ 347
METRIC RANK
$89,638
MEDIAN HOUSEHOLD INCOME
94.8/ 100
METRIC RATING
122nd/ 347
METRIC RANK
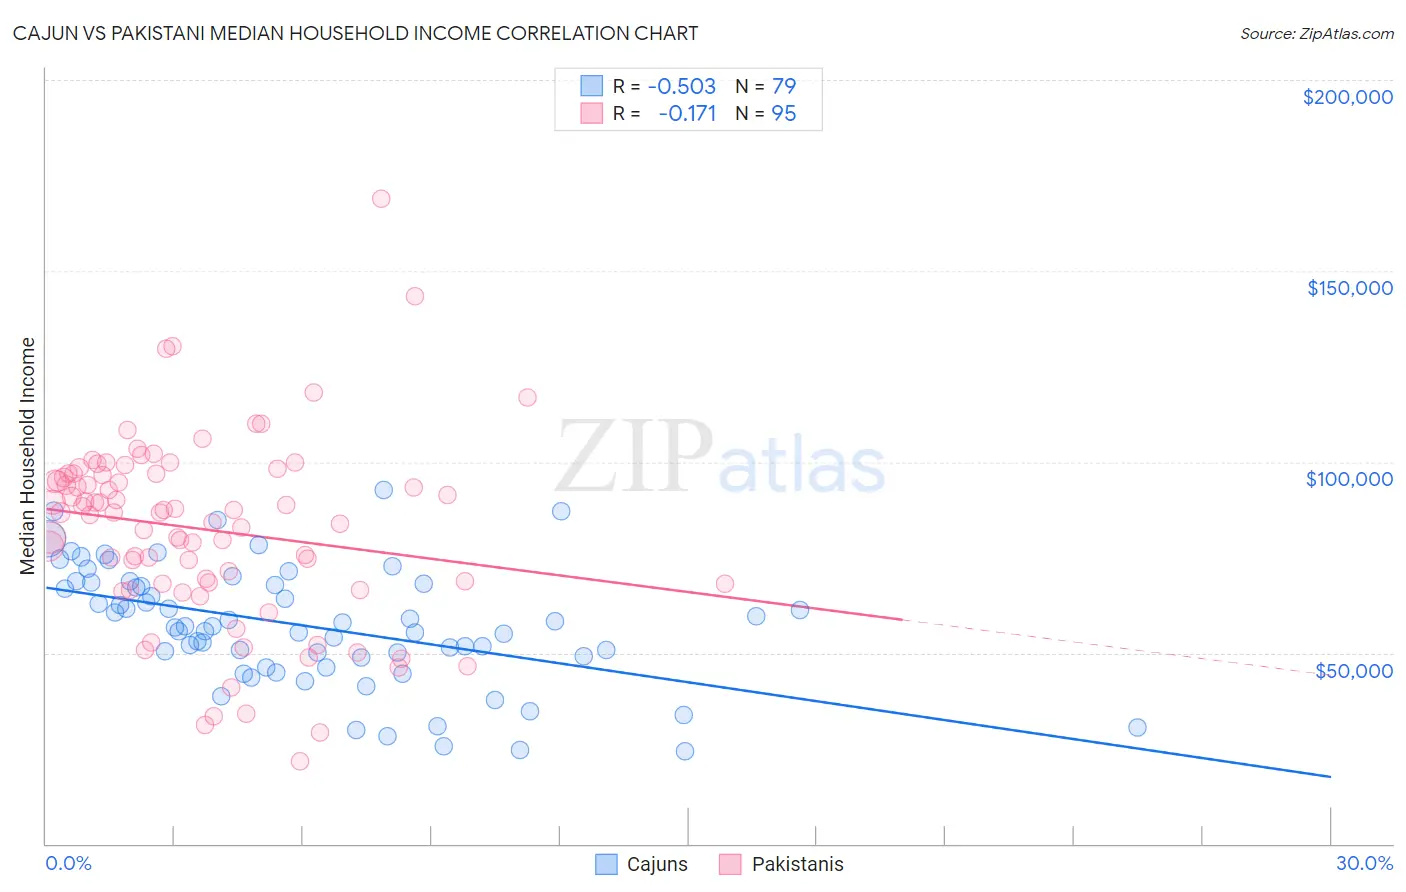
Cajun vs Pakistani Median Household Income Correlation Chart
The statistical analysis conducted on geographies consisting of 149,670,755 people shows a substantial negative correlation between the proportion of Cajuns and median household income in the United States with a correlation coefficient (R) of -0.503 and weighted average of $70,605. Similarly, the statistical analysis conducted on geographies consisting of 335,154,769 people shows a poor negative correlation between the proportion of Pakistanis and median household income in the United States with a correlation coefficient (R) of -0.171 and weighted average of $89,638, a difference of 27.0%.
Median Household Income Correlation Summary
| Measurement | Cajun | Pakistani |
| Minimum | $24,375 | $21,500 |
| Maximum | $92,480 | $169,063 |
| Range | $68,105 | $147,563 |
| Mean | $57,001 | $82,388 |
| Median | $56,809 | $86,853 |
| Interquartile 25% (IQ1) | $48,865 | $68,125 |
| Interquartile 75% (IQ3) | $68,083 | $96,894 |
| Interquartile Range (IQR) | $19,218 | $28,769 |
| Standard Deviation (Sample) | $15,446 | $24,553 |
| Standard Deviation (Population) | $15,348 | $24,423 |
Similar Demographics by Median Household Income
Demographics Similar to Cajuns by Median Household Income
In terms of median household income, the demographic groups most similar to Cajuns are Chippewa ($70,539, a difference of 0.090%), Apache ($70,927, a difference of 0.46%), Ottawa ($70,984, a difference of 0.54%), Immigrants from Dominican Republic ($70,208, a difference of 0.56%), and Colville ($70,094, a difference of 0.73%).
| Demographics | Rating | Rank | Median Household Income |
| U.S. Virgin Islanders | 0.0 /100 | #310 | Tragic $71,853 |
| Immigrants | Zaire | 0.0 /100 | #311 | Tragic $71,801 |
| Immigrants | Honduras | 0.0 /100 | #312 | Tragic $71,452 |
| Immigrants | Bahamas | 0.0 /100 | #313 | Tragic $71,349 |
| Dominicans | 0.0 /100 | #314 | Tragic $71,302 |
| Ottawa | 0.0 /100 | #315 | Tragic $70,984 |
| Apache | 0.0 /100 | #316 | Tragic $70,927 |
| Cajuns | 0.0 /100 | #317 | Tragic $70,605 |
| Chippewa | 0.0 /100 | #318 | Tragic $70,539 |
| Immigrants | Dominican Republic | 0.0 /100 | #319 | Tragic $70,208 |
| Colville | 0.0 /100 | #320 | Tragic $70,094 |
| Chickasaw | 0.0 /100 | #321 | Tragic $70,005 |
| Choctaw | 0.0 /100 | #322 | Tragic $69,947 |
| Bahamians | 0.0 /100 | #323 | Tragic $69,726 |
| Yup'ik | 0.0 /100 | #324 | Tragic $69,695 |
Demographics Similar to Pakistanis by Median Household Income
In terms of median household income, the demographic groups most similar to Pakistanis are Ethiopian ($89,640, a difference of 0.0%), Immigrants from North Macedonia ($89,741, a difference of 0.11%), Albanian ($89,744, a difference of 0.12%), Immigrants from Zimbabwe ($89,496, a difference of 0.16%), and Syrian ($89,830, a difference of 0.21%).
| Demographics | Rating | Rank | Median Household Income |
| Immigrants | Western Asia | 95.9 /100 | #115 | Exceptional $90,005 |
| Native Hawaiians | 95.7 /100 | #116 | Exceptional $89,919 |
| Taiwanese | 95.6 /100 | #117 | Exceptional $89,900 |
| Syrians | 95.4 /100 | #118 | Exceptional $89,830 |
| Albanians | 95.2 /100 | #119 | Exceptional $89,744 |
| Immigrants | North Macedonia | 95.2 /100 | #120 | Exceptional $89,741 |
| Ethiopians | 94.9 /100 | #121 | Exceptional $89,640 |
| Pakistanis | 94.8 /100 | #122 | Exceptional $89,638 |
| Immigrants | Zimbabwe | 94.4 /100 | #123 | Exceptional $89,496 |
| Immigrants | Jordan | 94.1 /100 | #124 | Exceptional $89,412 |
| Immigrants | Kuwait | 93.5 /100 | #125 | Exceptional $89,263 |
| Immigrants | Oceania | 92.9 /100 | #126 | Exceptional $89,100 |
| Immigrants | Peru | 92.5 /100 | #127 | Exceptional $89,010 |
| Portuguese | 92.3 /100 | #128 | Exceptional $88,976 |
| Brazilians | 92.1 /100 | #129 | Exceptional $88,934 |