Cajun vs Danish 6th Grade
COMPARE
Cajun
Danish
6th Grade
6th Grade Comparison
Cajuns
Danes
97.6%
6TH GRADE
99.5/ 100
METRIC RATING
70th/ 347
METRIC RANK
98.0%
6TH GRADE
100.0/ 100
METRIC RATING
22nd/ 347
METRIC RANK
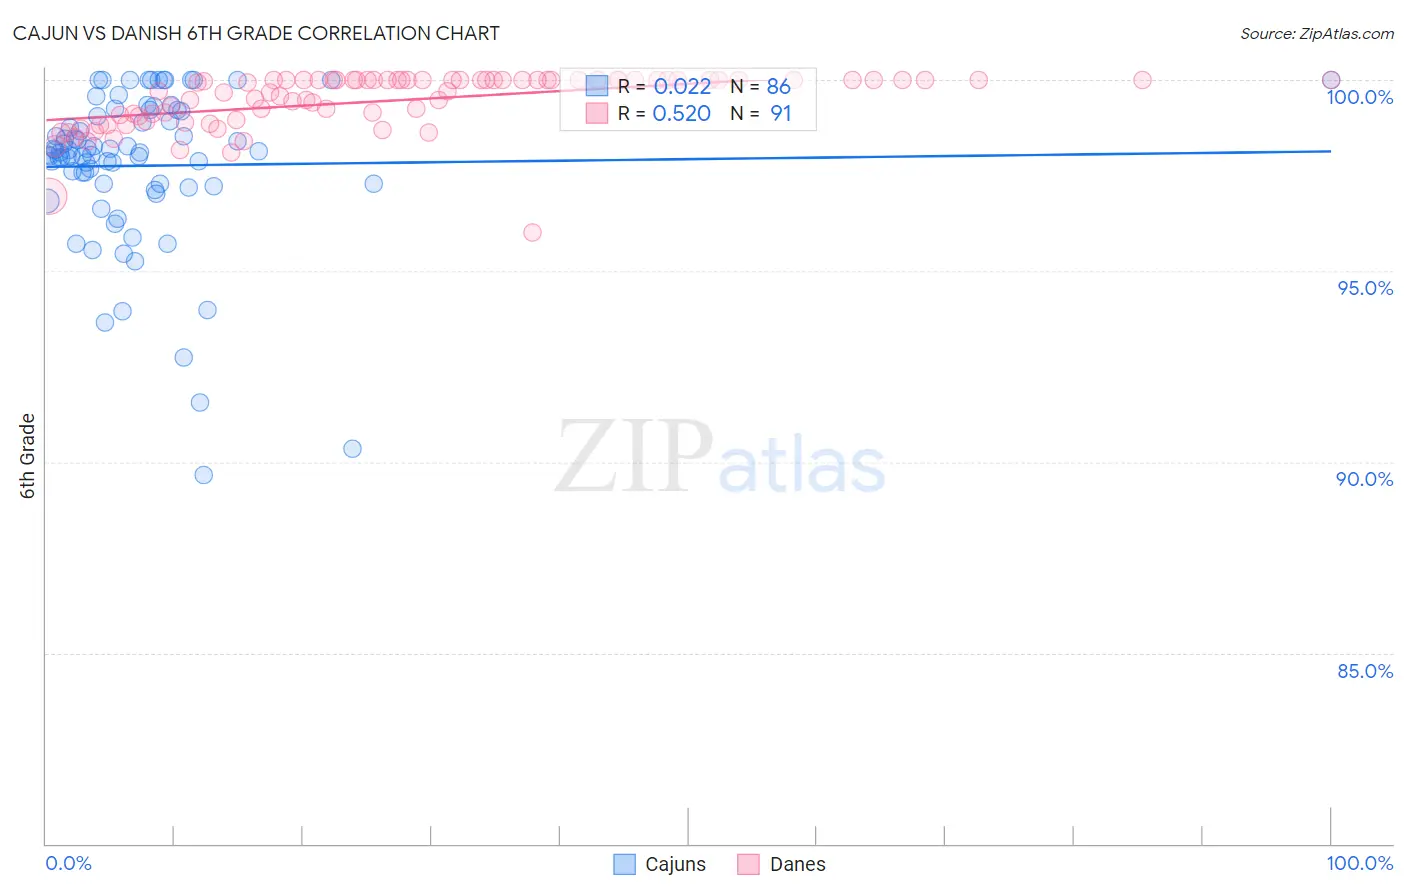
Cajun vs Danish 6th Grade Correlation Chart
The statistical analysis conducted on geographies consisting of 149,712,957 people shows no correlation between the proportion of Cajuns and percentage of population with at least 6th grade education in the United States with a correlation coefficient (R) of 0.022 and weighted average of 97.6%. Similarly, the statistical analysis conducted on geographies consisting of 474,193,610 people shows a substantial positive correlation between the proportion of Danes and percentage of population with at least 6th grade education in the United States with a correlation coefficient (R) of 0.520 and weighted average of 98.0%, a difference of 0.42%.
6th Grade Correlation Summary
| Measurement | Cajun | Danish |
| Minimum | 89.7% | 96.0% |
| Maximum | 100.0% | 100.0% |
| Range | 10.3% | 4.0% |
| Mean | 97.8% | 99.5% |
| Median | 98.1% | 99.9% |
| Interquartile 25% (IQ1) | 97.3% | 99.0% |
| Interquartile 75% (IQ3) | 99.2% | 100.0% |
| Interquartile Range (IQR) | 1.9% | 1.0% |
| Standard Deviation (Sample) | 2.1% | 0.74% |
| Standard Deviation (Population) | 2.1% | 0.73% |
Similar Demographics by 6th Grade
Demographics Similar to Cajuns by 6th Grade
In terms of 6th grade, the demographic groups most similar to Cajuns are Iranian (97.6%, a difference of 0.010%), Chickasaw (97.6%, a difference of 0.010%), Macedonian (97.6%, a difference of 0.020%), Cherokee (97.6%, a difference of 0.020%), and New Zealander (97.7%, a difference of 0.030%).
| Demographics | Rating | Rank | 6th Grade |
| Russians | 99.7 /100 | #63 | Exceptional 97.7% |
| Canadians | 99.7 /100 | #64 | Exceptional 97.7% |
| Immigrants | Northern Europe | 99.6 /100 | #65 | Exceptional 97.7% |
| New Zealanders | 99.6 /100 | #66 | Exceptional 97.7% |
| Kiowa | 99.6 /100 | #67 | Exceptional 97.7% |
| Immigrants | Austria | 99.6 /100 | #68 | Exceptional 97.7% |
| Iranians | 99.6 /100 | #69 | Exceptional 97.6% |
| Cajuns | 99.5 /100 | #70 | Exceptional 97.6% |
| Chickasaw | 99.5 /100 | #71 | Exceptional 97.6% |
| Macedonians | 99.4 /100 | #72 | Exceptional 97.6% |
| Cherokee | 99.4 /100 | #73 | Exceptional 97.6% |
| Immigrants | Netherlands | 99.4 /100 | #74 | Exceptional 97.6% |
| Ukrainians | 99.4 /100 | #75 | Exceptional 97.6% |
| Immigrants | England | 99.4 /100 | #76 | Exceptional 97.6% |
| Immigrants | Lithuania | 99.3 /100 | #77 | Exceptional 97.6% |
Demographics Similar to Danes by 6th Grade
In terms of 6th grade, the demographic groups most similar to Danes are Sioux (98.0%, a difference of 0.010%), Croatian (98.0%, a difference of 0.010%), Lithuanian (98.1%, a difference of 0.020%), Scotch-Irish (98.0%, a difference of 0.020%), and Finnish (98.1%, a difference of 0.030%).
| Demographics | Rating | Rank | 6th Grade |
| Inupiat | 100.0 /100 | #15 | Exceptional 98.1% |
| Scottish | 100.0 /100 | #16 | Exceptional 98.1% |
| Poles | 100.0 /100 | #17 | Exceptional 98.1% |
| Pennsylvania Germans | 100.0 /100 | #18 | Exceptional 98.1% |
| Irish | 100.0 /100 | #19 | Exceptional 98.1% |
| Finns | 100.0 /100 | #20 | Exceptional 98.1% |
| Lithuanians | 100.0 /100 | #21 | Exceptional 98.1% |
| Danes | 100.0 /100 | #22 | Exceptional 98.0% |
| Sioux | 100.0 /100 | #23 | Exceptional 98.0% |
| Croatians | 100.0 /100 | #24 | Exceptional 98.0% |
| Scotch-Irish | 100.0 /100 | #25 | Exceptional 98.0% |
| Czechs | 100.0 /100 | #26 | Exceptional 98.0% |
| Yup'ik | 100.0 /100 | #27 | Exceptional 98.0% |
| Scandinavians | 100.0 /100 | #28 | Exceptional 98.0% |
| French | 100.0 /100 | #29 | Exceptional 98.0% |