Cajun vs Basque Median Household Income

COMPARE

Cajun
Race
Ancestry
AfghanAfricanAlaska NativeAlaskan AthabascanAlbanianAleutAlsatianAmericanApacheArabArapahoArgentineanArmenianAssyrian/Chaldean/SyriacAustralianAustrianBahamianBangladeshiBarbadianBelgianBelizeanBermudanBhutaneseBlackfeetBolivianBrazilianBritishBritish West IndianBulgarianBurmeseCajunCambodianCanadianCape VerdeanCarpatho RusynCelticCentral AmericanCentral American IndianCherokeeCheyenneChickasawChileanChineseChippewaChoctawColombianColvilleComancheCosta RicanCreeCreekCroatianCrowCubanCypriotCzechCzechoslovakianDanishDelawareDominicanDutchDutch West IndianEastern EuropeanEcuadorianEgyptianEnglishEstonianEthiopianEuropeanFijianFilipinoFinnishFrenchFrench American IndianFrench CanadianGermanGerman RussianGhanaianGreekGuamanian/ChamorroGuatemalanGuyaneseHaitianHmongHonduranHopiHoumaHungarianIcelanderIndian (Asian)IndonesianInupiatIranianIraqiIrishIroquoisIsraeliItalianJamaicanJapaneseJordanianKenyanKiowaKoreanLaotianLatvianLebaneseLiberianLithuanianLumbeeLuxembourgerMacedonianMalaysianMalteseMarshalleseMenomineeMexicanMexican American IndianMongolianMoroccanNative HawaiianNavajoNepaleseNew ZealanderNicaraguanNigerianNorthern EuropeanNorwegianOkinawanOsageOttawaPaiutePakistaniPalestinianPanamanianParaguayanPennsylvania GermanPeruvianPimaPolishPortuguesePotawatomiPuebloPuerto RicanPuget Sound SalishRomanianRussianSalvadoranSamoanScandinavianScotch-IrishScottishSeminoleSenegaleseSerbianShoshoneSierra LeoneanSiouxSlavicSlovakSloveneSomaliSouth AfricanSouth AmericanSouth American IndianSoviet UnionSpaniardSpanishSpanish AmericanSpanish American IndianSri LankanSubsaharan AfricanSudaneseSwedishSwissSyrianTaiwaneseThaiTlingit-HaidaTohono O'OdhamTonganTrinidadian and TobagonianTsimshianTurkishU.S. Virgin IslanderUgandanUkrainianUruguayanUteVenezuelanVietnameseWelshWest IndianYakamaYaquiYugoslavianYumanYup'ikZimbabwean
Immigration
NonimmigrantsImmigrantsAfghanistanAfricaAlbaniaArgentinaArmeniaAsiaAustraliaAustriaBahamasBangladeshBarbadosBelarusBelgiumBelizeBoliviaBosnia and HerzegovinaBrazilBulgariaBurma/MyanmarCabo VerdeCambodiaCameroonCanadaCaribbeanCentral AmericaChileChinaColombiaCongoCosta RicaCroatiaCubaCzechoslovakiaDenmarkDominicaDominican RepublicEastern AfricaEastern AsiaEastern EuropeEcuadorEgyptEl SalvadorEnglandEritreaEthiopiaEuropeFijiFranceGermanyGhanaGreeceGrenadaGuatemalaGuyanaHaitiHondurasHong KongHungaryIndiaIndonesiaIranIraqIrelandIsraelItalyJamaicaJapanJordanKazakhstanKenyaKoreaKuwaitLaosLatin AmericaLatviaLebanonLiberiaLithuaniaMalaysiaMexicoMicronesiaMiddle AfricaMoldovaMoroccoNepalNetherlandsNicaraguaNigeriaNorth AmericaNorth MacedoniaNorthern AfricaNorthern EuropeNorwayOceaniaPakistanPanamaPeruPhilippinesPolandPortugalRomaniaRussiaSaudi ArabiaScotlandSenegalSerbiaSierra LeoneSingaporeSomaliaSouth AfricaSouth AmericaSouth Central AsiaSouth Eastern AsiaSouthern EuropeSpainSri LankaSt. Vincent and the GrenadinesSudanSwedenSwitzerlandSyriaTaiwanThailandTrinidad and TobagoTurkeyUgandaUkraineUruguayUzbekistanVenezuelaVietnamWest IndiesWestern AfricaWestern AsiaWestern EuropeYemenZaireZimbabweAzores
Basque
Race
Ancestry
AfghanAfricanAlaska NativeAlaskan AthabascanAlbanianAleutAlsatianAmericanApacheArabArapahoArgentineanArmenianAssyrian/Chaldean/SyriacAustralianAustrianBahamianBangladeshiBarbadianBasqueBelgianBelizeanBermudanBhutaneseBlackfeetBolivianBrazilianBritishBritish West IndianBulgarianBurmeseCambodianCanadianCape VerdeanCarpatho RusynCelticCentral AmericanCentral American IndianCherokeeCheyenneChickasawChileanChineseChippewaChoctawColombianColvilleComancheCosta RicanCreeCreekCroatianCrowCubanCypriotCzechCzechoslovakianDanishDelawareDominicanDutchDutch West IndianEastern EuropeanEcuadorianEgyptianEnglishEstonianEthiopianEuropeanFijianFilipinoFinnishFrenchFrench American IndianFrench CanadianGermanGerman RussianGhanaianGreekGuamanian/ChamorroGuatemalanGuyaneseHaitianHmongHonduranHopiHoumaHungarianIcelanderIndian (Asian)IndonesianInupiatIranianIraqiIrishIroquoisIsraeliItalianJamaicanJapaneseJordanianKenyanKiowaKoreanLaotianLatvianLebaneseLiberianLithuanianLumbeeLuxembourgerMacedonianMalaysianMalteseMarshalleseMenomineeMexicanMexican American IndianMongolianMoroccanNative HawaiianNavajoNepaleseNew ZealanderNicaraguanNigerianNorthern EuropeanNorwegianOkinawanOsageOttawaPaiutePakistaniPalestinianPanamanianParaguayanPennsylvania GermanPeruvianPimaPolishPortuguesePotawatomiPuebloPuerto RicanPuget Sound SalishRomanianRussianSalvadoranSamoanScandinavianScotch-IrishScottishSeminoleSenegaleseSerbianShoshoneSierra LeoneanSiouxSlavicSlovakSloveneSomaliSouth AfricanSouth AmericanSouth American IndianSoviet UnionSpaniardSpanishSpanish AmericanSpanish American IndianSri LankanSubsaharan AfricanSudaneseSwedishSwissSyrianTaiwaneseThaiTlingit-HaidaTohono O'OdhamTonganTrinidadian and TobagonianTsimshianTurkishU.S. Virgin IslanderUgandanUkrainianUruguayanUteVenezuelanVietnameseWelshWest IndianYakamaYaquiYugoslavianYumanYup'ikZimbabwean
Immigration
NonimmigrantsImmigrantsAfghanistanAfricaAlbaniaArgentinaArmeniaAsiaAustraliaAustriaBahamasBangladeshBarbadosBelarusBelgiumBelizeBoliviaBosnia and HerzegovinaBrazilBulgariaBurma/MyanmarCabo VerdeCambodiaCameroonCanadaCaribbeanCentral AmericaChileChinaColombiaCongoCosta RicaCroatiaCubaCzechoslovakiaDenmarkDominicaDominican RepublicEastern AfricaEastern AsiaEastern EuropeEcuadorEgyptEl SalvadorEnglandEritreaEthiopiaEuropeFijiFranceGermanyGhanaGreeceGrenadaGuatemalaGuyanaHaitiHondurasHong KongHungaryIndiaIndonesiaIranIraqIrelandIsraelItalyJamaicaJapanJordanKazakhstanKenyaKoreaKuwaitLaosLatin AmericaLatviaLebanonLiberiaLithuaniaMalaysiaMexicoMicronesiaMiddle AfricaMoldovaMoroccoNepalNetherlandsNicaraguaNigeriaNorth AmericaNorth MacedoniaNorthern AfricaNorthern EuropeNorwayOceaniaPakistanPanamaPeruPhilippinesPolandPortugalRomaniaRussiaSaudi ArabiaScotlandSenegalSerbiaSierra LeoneSingaporeSomaliaSouth AfricaSouth AmericaSouth Central AsiaSouth Eastern AsiaSouthern EuropeSpainSri LankaSt. Vincent and the GrenadinesSudanSwedenSwitzerlandSyriaTaiwanThailandTrinidad and TobagoTurkeyUgandaUkraineUruguayUzbekistanVenezuelaVietnamWest IndiesWestern AfricaWestern AsiaWestern EuropeYemenZaireZimbabweAzores
Median Household Income
Income
Poverty
Unemployment
Labor Participation
Family Structure
Vehicle Availability
Education Level
Disability

Median Household Income Comparison

Cajuns

Basques

Tragic
Good
$70,605
MEDIAN HOUSEHOLD INCOME
0.0/ 100
METRIC RATING
317th/ 347
METRIC RANK
$87,001
MEDIAN HOUSEHOLD INCOME
77.2/ 100
METRIC RATING
150th/ 347
METRIC RANK

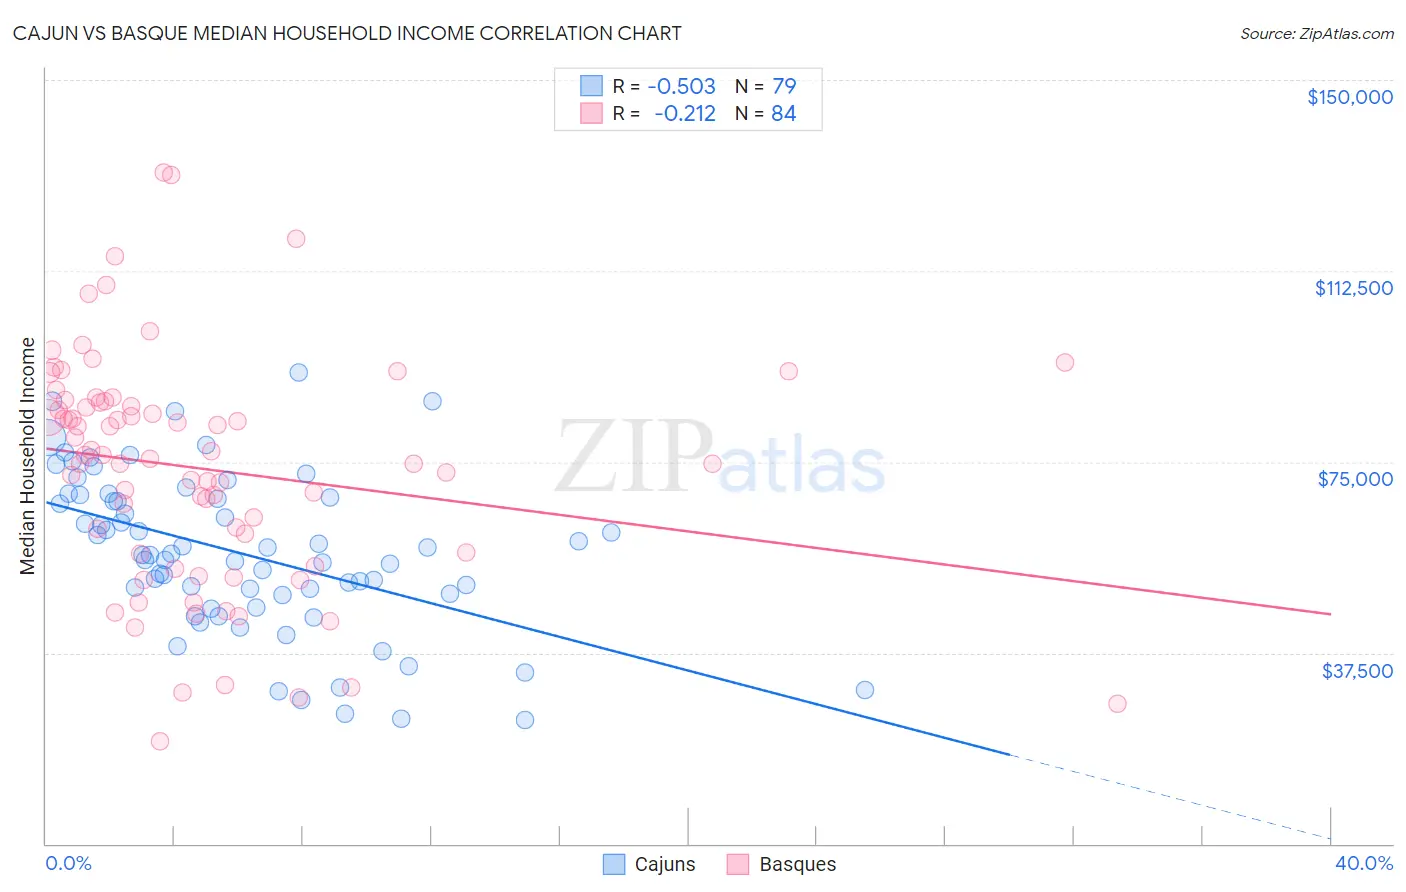
Cajun vs Basque Median Household Income Correlation Chart

The statistical analysis conducted on geographies consisting of 149,670,755 people shows a substantial negative correlation between the proportion of Cajuns and median household income in the United States with a correlation coefficient (R) of -0.503 and weighted average of $70,605. Similarly, the statistical analysis conducted on geographies consisting of 165,746,357 people shows a weak negative correlation between the proportion of Basques and median household income in the United States with a correlation coefficient (R) of -0.212 and weighted average of $87,001, a difference of 23.2%.
Cajun vs Basque Median Household Income

Median Household Income Correlation Summary

MeasurementCajunBasque
Minimum$24,375$20,139
Maximum$92,480$131,838
Range$68,105$111,699
Mean$57,001$73,627
Median$56,809$76,033
Interquartile 25% (IQ1)$48,865$57,079
Interquartile 75% (IQ3)$68,083$86,843
Interquartile Range (IQR)$19,218$29,764
Standard Deviation (Sample)$15,446$22,838
Standard Deviation (Population)$15,348$22,701

Similar Demographics by Median Household Income

Demographics Similar to Cajuns by Median Household Income

In terms of median household income, the demographic groups most similar to Cajuns are Chippewa ($70,539, a difference of 0.090%), Apache ($70,927, a difference of 0.46%), Ottawa ($70,984, a difference of 0.54%), Immigrants from Dominican Republic ($70,208, a difference of 0.56%), and Colville ($70,094, a difference of 0.73%).
DemographicsRating | RankMedian Household Income
U.S. Virgin Islanders
0.0
/100
|
#310
Tragic
$71,853
Immigrants | Zaire
0.0
/100
|
#311
Tragic
$71,801
Immigrants | Honduras
0.0
/100
|
#312
Tragic
$71,452
Immigrants | Bahamas
0.0
/100
|
#313
Tragic
$71,349
Dominicans
0.0
/100
|
#314
Tragic
$71,302
Ottawa
0.0
/100
|
#315
Tragic
$70,984
Apache
0.0
/100
|
#316
Tragic
$70,927
Cajuns
0.0
/100
|
#317
Tragic
$70,605
Chippewa
0.0
/100
|
#318
Tragic
$70,539
Immigrants | Dominican Republic
0.0
/100
|
#319
Tragic
$70,208
Colville
0.0
/100
|
#320
Tragic
$70,094
Chickasaw
0.0
/100
|
#321
Tragic
$70,005
Choctaw
0.0
/100
|
#322
Tragic
$69,947
Bahamians
0.0
/100
|
#323
Tragic
$69,726
Yup'ik
0.0
/100
|
#324
Tragic
$69,695

Demographics Similar to Basques by Median Household Income

In terms of median household income, the demographic groups most similar to Basques are Immigrants from Nepal ($87,046, a difference of 0.050%), Hungarian ($86,920, a difference of 0.090%), Immigrants from Saudi Arabia ($86,875, a difference of 0.15%), South American ($86,824, a difference of 0.20%), and Immigrants from Germany ($86,764, a difference of 0.27%).
DemographicsRating | RankMedian Household Income
Danes
83.9
/100
|
#143
Excellent
$87,676
Serbians
83.0
/100
|
#144
Excellent
$87,572
Ugandans
82.9
/100
|
#145
Excellent
$87,557
Immigrants | Uganda
82.8
/100
|
#146
Excellent
$87,553
South American Indians
81.8
/100
|
#147
Excellent
$87,446
Costa Ricans
80.0
/100
|
#148
Excellent
$87,262
Immigrants | Nepal
77.7
/100
|
#149
Good
$87,046
Basques
77.2
/100
|
#150
Good
$87,001
Hungarians
76.3
/100
|
#151
Good
$86,920
Immigrants | Saudi Arabia
75.8
/100
|
#152
Good
$86,875
South Americans
75.1
/100
|
#153
Good
$86,824
Immigrants | Germany
74.4
/100
|
#154
Good
$86,764
Carpatho Rusyns
72.8
/100
|
#155
Good
$86,635
Immigrants | Albania
71.5
/100
|
#156
Good
$86,534
Samoans
71.0
/100
|
#157
Good
$86,498