Brazilian vs Immigrants from Nepal Median Household Income
COMPARE
Brazilian
Immigrants from Nepal
Median Household Income
Median Household Income Comparison
Brazilians
Immigrants from Nepal
$88,934
MEDIAN HOUSEHOLD INCOME
92.1/ 100
METRIC RATING
129th/ 347
METRIC RANK
$87,046
MEDIAN HOUSEHOLD INCOME
77.7/ 100
METRIC RATING
149th/ 347
METRIC RANK
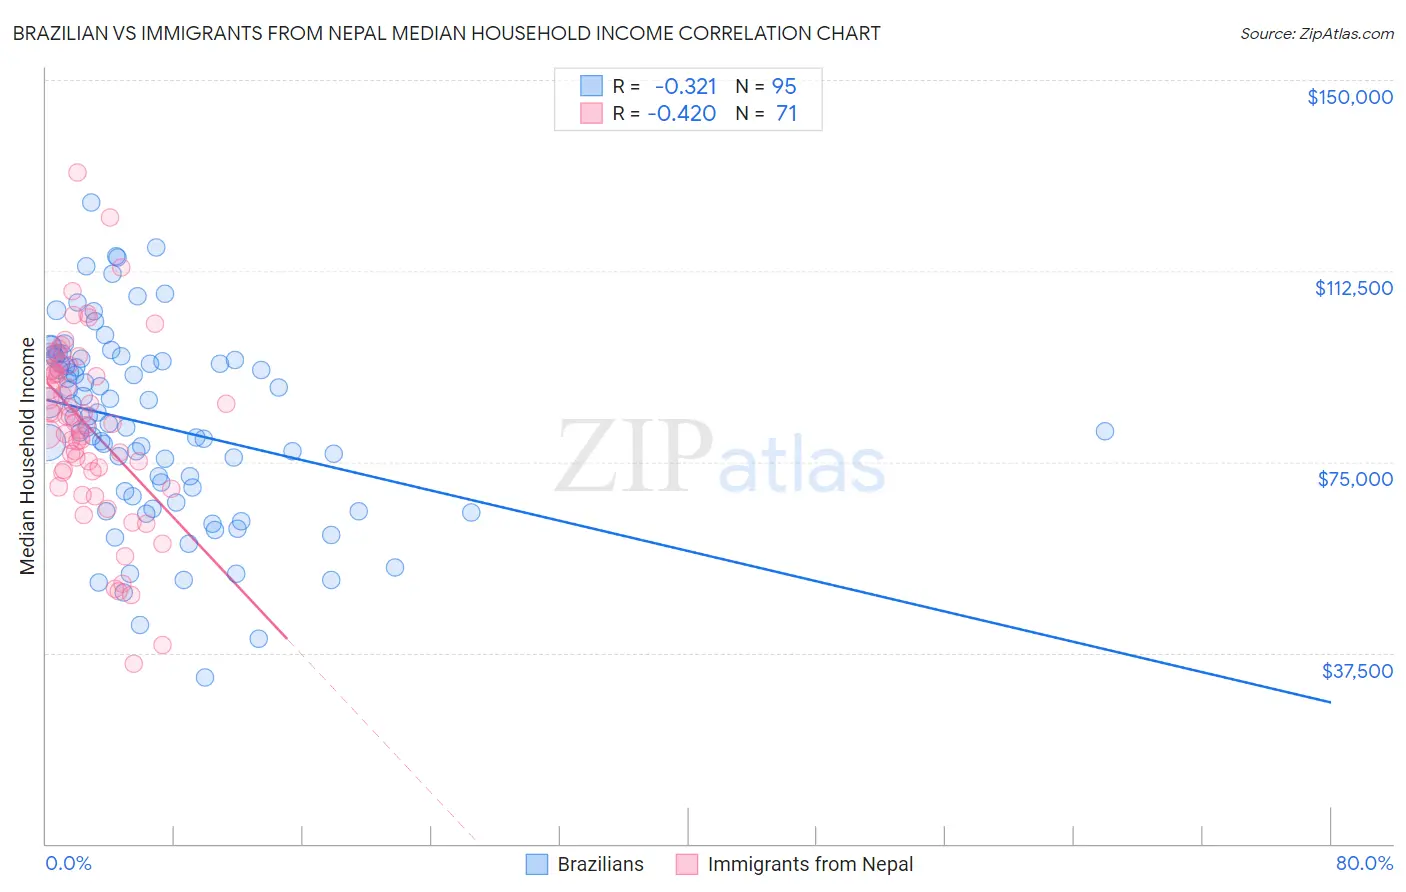
Brazilian vs Immigrants from Nepal Median Household Income Correlation Chart
The statistical analysis conducted on geographies consisting of 323,646,187 people shows a mild negative correlation between the proportion of Brazilians and median household income in the United States with a correlation coefficient (R) of -0.321 and weighted average of $88,934. Similarly, the statistical analysis conducted on geographies consisting of 186,662,148 people shows a moderate negative correlation between the proportion of Immigrants from Nepal and median household income in the United States with a correlation coefficient (R) of -0.420 and weighted average of $87,046, a difference of 2.2%.
Median Household Income Correlation Summary
| Measurement | Brazilian | Immigrants from Nepal |
| Minimum | $32,591 | $35,329 |
| Maximum | $126,001 | $131,777 |
| Range | $93,410 | $96,448 |
| Mean | $82,158 | $81,976 |
| Median | $83,690 | $82,737 |
| Interquartile 25% (IQ1) | $68,333 | $73,125 |
| Interquartile 75% (IQ3) | $94,909 | $92,873 |
| Interquartile Range (IQR) | $26,576 | $19,748 |
| Standard Deviation (Sample) | $18,705 | $17,803 |
| Standard Deviation (Population) | $18,606 | $17,677 |
Demographics Similar to Brazilians and Immigrants from Nepal by Median Household Income
In terms of median household income, the demographic groups most similar to Brazilians are British ($88,914, a difference of 0.020%), Immigrants from Syria ($88,792, a difference of 0.16%), European ($88,751, a difference of 0.21%), Immigrants from Ethiopia ($88,687, a difference of 0.28%), and Swedish ($88,524, a difference of 0.46%). Similarly, the demographic groups most similar to Immigrants from Nepal are Costa Rican ($87,262, a difference of 0.25%), South American Indian ($87,446, a difference of 0.46%), Immigrants from Uganda ($87,553, a difference of 0.58%), Ugandan ($87,557, a difference of 0.59%), and Serbian ($87,572, a difference of 0.60%).
| Demographics | Rating | Rank | Median Household Income |
| Brazilians | 92.1 /100 | #129 | Exceptional $88,934 |
| British | 92.0 /100 | #130 | Exceptional $88,914 |
| Immigrants | Syria | 91.4 /100 | #131 | Exceptional $88,792 |
| Europeans | 91.2 /100 | #132 | Exceptional $88,751 |
| Immigrants | Ethiopia | 90.9 /100 | #133 | Exceptional $88,687 |
| Swedes | 90.0 /100 | #134 | Exceptional $88,524 |
| Immigrants | Sierra Leone | 89.9 /100 | #135 | Excellent $88,498 |
| Poles | 89.7 /100 | #136 | Excellent $88,472 |
| Sierra Leoneans | 89.6 /100 | #137 | Excellent $88,463 |
| Arabs | 89.2 /100 | #138 | Excellent $88,398 |
| Immigrants | Chile | 89.2 /100 | #139 | Excellent $88,388 |
| Lebanese | 87.2 /100 | #140 | Excellent $88,091 |
| Immigrants | Morocco | 86.0 /100 | #141 | Excellent $87,930 |
| Canadians | 84.7 /100 | #142 | Excellent $87,769 |
| Danes | 83.9 /100 | #143 | Excellent $87,676 |
| Serbians | 83.0 /100 | #144 | Excellent $87,572 |
| Ugandans | 82.9 /100 | #145 | Excellent $87,557 |
| Immigrants | Uganda | 82.8 /100 | #146 | Excellent $87,553 |
| South American Indians | 81.8 /100 | #147 | Excellent $87,446 |
| Costa Ricans | 80.0 /100 | #148 | Excellent $87,262 |
| Immigrants | Nepal | 77.7 /100 | #149 | Good $87,046 |