Brazilian vs Immigrants from Albania Median Household Income
COMPARE
Brazilian
Immigrants from Albania
Median Household Income
Median Household Income Comparison
Brazilians
Immigrants from Albania
$88,934
MEDIAN HOUSEHOLD INCOME
92.1/ 100
METRIC RATING
129th/ 347
METRIC RANK
$86,534
MEDIAN HOUSEHOLD INCOME
71.5/ 100
METRIC RATING
156th/ 347
METRIC RANK
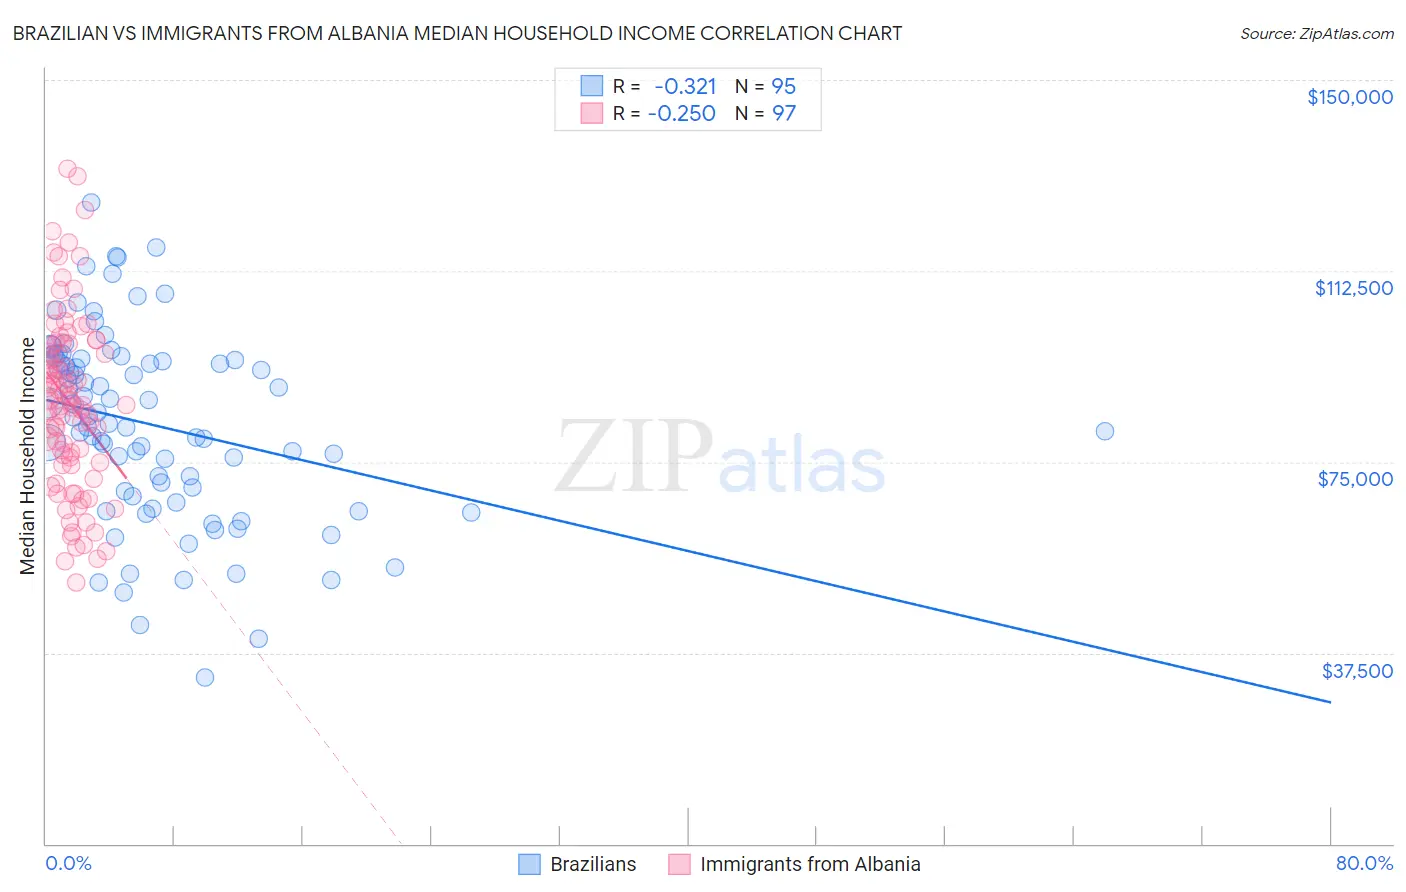
Brazilian vs Immigrants from Albania Median Household Income Correlation Chart
The statistical analysis conducted on geographies consisting of 323,646,187 people shows a mild negative correlation between the proportion of Brazilians and median household income in the United States with a correlation coefficient (R) of -0.321 and weighted average of $88,934. Similarly, the statistical analysis conducted on geographies consisting of 119,343,332 people shows a weak negative correlation between the proportion of Immigrants from Albania and median household income in the United States with a correlation coefficient (R) of -0.250 and weighted average of $86,534, a difference of 2.8%.
Median Household Income Correlation Summary
| Measurement | Brazilian | Immigrants from Albania |
| Minimum | $32,591 | $51,316 |
| Maximum | $126,001 | $132,457 |
| Range | $93,410 | $81,141 |
| Mean | $82,158 | $86,652 |
| Median | $83,690 | $86,175 |
| Interquartile 25% (IQ1) | $68,333 | $74,686 |
| Interquartile 75% (IQ3) | $94,909 | $98,070 |
| Interquartile Range (IQR) | $26,576 | $23,384 |
| Standard Deviation (Sample) | $18,705 | $17,379 |
| Standard Deviation (Population) | $18,606 | $17,290 |
Similar Demographics by Median Household Income
Demographics Similar to Brazilians by Median Household Income
In terms of median household income, the demographic groups most similar to Brazilians are British ($88,914, a difference of 0.020%), Portuguese ($88,976, a difference of 0.050%), Immigrants from Peru ($89,010, a difference of 0.090%), Immigrants from Syria ($88,792, a difference of 0.16%), and Immigrants from Oceania ($89,100, a difference of 0.19%).
| Demographics | Rating | Rank | Median Household Income |
| Pakistanis | 94.8 /100 | #122 | Exceptional $89,638 |
| Immigrants | Zimbabwe | 94.4 /100 | #123 | Exceptional $89,496 |
| Immigrants | Jordan | 94.1 /100 | #124 | Exceptional $89,412 |
| Immigrants | Kuwait | 93.5 /100 | #125 | Exceptional $89,263 |
| Immigrants | Oceania | 92.9 /100 | #126 | Exceptional $89,100 |
| Immigrants | Peru | 92.5 /100 | #127 | Exceptional $89,010 |
| Portuguese | 92.3 /100 | #128 | Exceptional $88,976 |
| Brazilians | 92.1 /100 | #129 | Exceptional $88,934 |
| British | 92.0 /100 | #130 | Exceptional $88,914 |
| Immigrants | Syria | 91.4 /100 | #131 | Exceptional $88,792 |
| Europeans | 91.2 /100 | #132 | Exceptional $88,751 |
| Immigrants | Ethiopia | 90.9 /100 | #133 | Exceptional $88,687 |
| Swedes | 90.0 /100 | #134 | Exceptional $88,524 |
| Immigrants | Sierra Leone | 89.9 /100 | #135 | Excellent $88,498 |
| Poles | 89.7 /100 | #136 | Excellent $88,472 |
Demographics Similar to Immigrants from Albania by Median Household Income
In terms of median household income, the demographic groups most similar to Immigrants from Albania are Samoan ($86,498, a difference of 0.040%), Moroccan ($86,468, a difference of 0.080%), Carpatho Rusyn ($86,635, a difference of 0.12%), Immigrants from Uzbekistan ($86,425, a difference of 0.13%), and Luxembourger ($86,418, a difference of 0.13%).
| Demographics | Rating | Rank | Median Household Income |
| Immigrants | Nepal | 77.7 /100 | #149 | Good $87,046 |
| Basques | 77.2 /100 | #150 | Good $87,001 |
| Hungarians | 76.3 /100 | #151 | Good $86,920 |
| Immigrants | Saudi Arabia | 75.8 /100 | #152 | Good $86,875 |
| South Americans | 75.1 /100 | #153 | Good $86,824 |
| Immigrants | Germany | 74.4 /100 | #154 | Good $86,764 |
| Carpatho Rusyns | 72.8 /100 | #155 | Good $86,635 |
| Immigrants | Albania | 71.5 /100 | #156 | Good $86,534 |
| Samoans | 71.0 /100 | #157 | Good $86,498 |
| Moroccans | 70.6 /100 | #158 | Good $86,468 |
| Immigrants | Uzbekistan | 70.1 /100 | #159 | Good $86,425 |
| Luxembourgers | 70.0 /100 | #160 | Good $86,418 |
| Slavs | 69.7 /100 | #161 | Good $86,398 |
| Guamanians/Chamorros | 67.7 /100 | #162 | Good $86,255 |
| Czechs | 66.4 /100 | #163 | Good $86,164 |