Brazilian vs Immigrants from Nepal Doctorate Degree
COMPARE
Brazilian
Immigrants from Nepal
Doctorate Degree
Doctorate Degree Comparison
Brazilians
Immigrants from Nepal
2.1%
DOCTORATE DEGREE
97.2/ 100
METRIC RATING
110th/ 347
METRIC RANK
2.2%
DOCTORATE DEGREE
99.3/ 100
METRIC RATING
88th/ 347
METRIC RANK
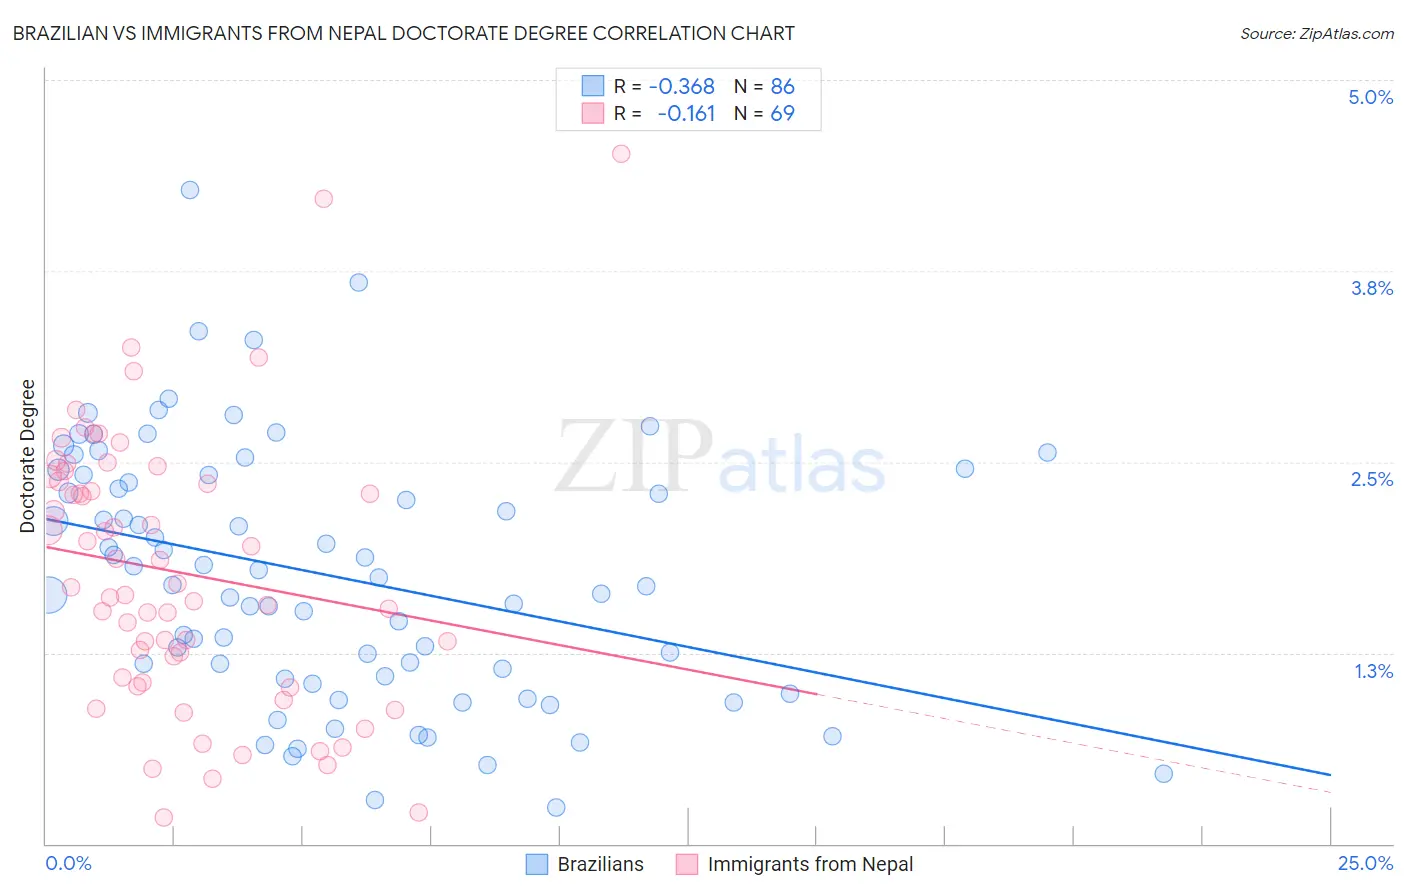
Brazilian vs Immigrants from Nepal Doctorate Degree Correlation Chart
The statistical analysis conducted on geographies consisting of 322,140,848 people shows a mild negative correlation between the proportion of Brazilians and percentage of population with at least doctorate degree education in the United States with a correlation coefficient (R) of -0.368 and weighted average of 2.1%. Similarly, the statistical analysis conducted on geographies consisting of 186,268,809 people shows a poor negative correlation between the proportion of Immigrants from Nepal and percentage of population with at least doctorate degree education in the United States with a correlation coefficient (R) of -0.161 and weighted average of 2.2%, a difference of 4.8%.
Doctorate Degree Correlation Summary
| Measurement | Brazilian | Immigrants from Nepal |
| Minimum | 0.24% | 0.17% |
| Maximum | 4.3% | 4.5% |
| Range | 4.0% | 4.3% |
| Mean | 1.8% | 1.8% |
| Median | 1.7% | 1.7% |
| Interquartile 25% (IQ1) | 1.1% | 1.1% |
| Interquartile 75% (IQ3) | 2.4% | 2.4% |
| Interquartile Range (IQR) | 1.3% | 1.3% |
| Standard Deviation (Sample) | 0.83% | 0.89% |
| Standard Deviation (Population) | 0.82% | 0.88% |
Similar Demographics by Doctorate Degree
Demographics Similar to Brazilians by Doctorate Degree
In terms of doctorate degree, the demographic groups most similar to Brazilians are Immigrants from Pakistan (2.1%, a difference of 0.060%), Ukrainian (2.1%, a difference of 0.070%), Syrian (2.1%, a difference of 0.080%), Immigrants from Germany (2.1%, a difference of 0.13%), and Immigrants from Italy (2.1%, a difference of 0.29%).
| Demographics | Rating | Rank | Doctorate Degree |
| Romanians | 98.1 /100 | #103 | Exceptional 2.1% |
| Austrians | 98.0 /100 | #104 | Exceptional 2.1% |
| Arabs | 97.8 /100 | #105 | Exceptional 2.1% |
| Sudanese | 97.7 /100 | #106 | Exceptional 2.1% |
| Europeans | 97.5 /100 | #107 | Exceptional 2.1% |
| Immigrants | Germany | 97.3 /100 | #108 | Exceptional 2.1% |
| Ukrainians | 97.2 /100 | #109 | Exceptional 2.1% |
| Brazilians | 97.2 /100 | #110 | Exceptional 2.1% |
| Immigrants | Pakistan | 97.1 /100 | #111 | Exceptional 2.1% |
| Syrians | 97.1 /100 | #112 | Exceptional 2.1% |
| Immigrants | Italy | 96.9 /100 | #113 | Exceptional 2.1% |
| Immigrants | Croatia | 96.8 /100 | #114 | Exceptional 2.1% |
| Taiwanese | 96.7 /100 | #115 | Exceptional 2.1% |
| Maltese | 96.2 /100 | #116 | Exceptional 2.1% |
| Lebanese | 96.0 /100 | #117 | Exceptional 2.1% |
Demographics Similar to Immigrants from Nepal by Doctorate Degree
In terms of doctorate degree, the demographic groups most similar to Immigrants from Nepal are Immigrants from Zimbabwe (2.2%, a difference of 0.36%), British (2.2%, a difference of 0.44%), Immigrants from Scotland (2.2%, a difference of 0.45%), Egyptian (2.2%, a difference of 0.47%), and Immigrants from Sudan (2.2%, a difference of 0.93%).
| Demographics | Rating | Rank | Doctorate Degree |
| Immigrants | Argentina | 99.7 /100 | #81 | Exceptional 2.2% |
| Immigrants | Uganda | 99.6 /100 | #82 | Exceptional 2.2% |
| Immigrants | Lithuania | 99.6 /100 | #83 | Exceptional 2.2% |
| Immigrants | England | 99.6 /100 | #84 | Exceptional 2.2% |
| Immigrants | Brazil | 99.6 /100 | #85 | Exceptional 2.2% |
| Egyptians | 99.4 /100 | #86 | Exceptional 2.2% |
| Immigrants | Zimbabwe | 99.4 /100 | #87 | Exceptional 2.2% |
| Immigrants | Nepal | 99.3 /100 | #88 | Exceptional 2.2% |
| British | 99.3 /100 | #89 | Exceptional 2.2% |
| Immigrants | Scotland | 99.2 /100 | #90 | Exceptional 2.2% |
| Immigrants | Sudan | 99.1 /100 | #91 | Exceptional 2.2% |
| Chileans | 99.1 /100 | #92 | Exceptional 2.2% |
| Alsatians | 99.0 /100 | #93 | Exceptional 2.1% |
| Greeks | 98.8 /100 | #94 | Exceptional 2.1% |
| Immigrants | Romania | 98.7 /100 | #95 | Exceptional 2.1% |