Immigrants from West Indies vs Immigrants from Nepal Median Household Income
COMPARE
Immigrants from West Indies
Immigrants from Nepal
Median Household Income
Median Household Income Comparison
Immigrants from West Indies
Immigrants from Nepal
$77,956
MEDIAN HOUSEHOLD INCOME
1.0/ 100
METRIC RATING
252nd/ 347
METRIC RANK
$87,046
MEDIAN HOUSEHOLD INCOME
77.7/ 100
METRIC RATING
149th/ 347
METRIC RANK
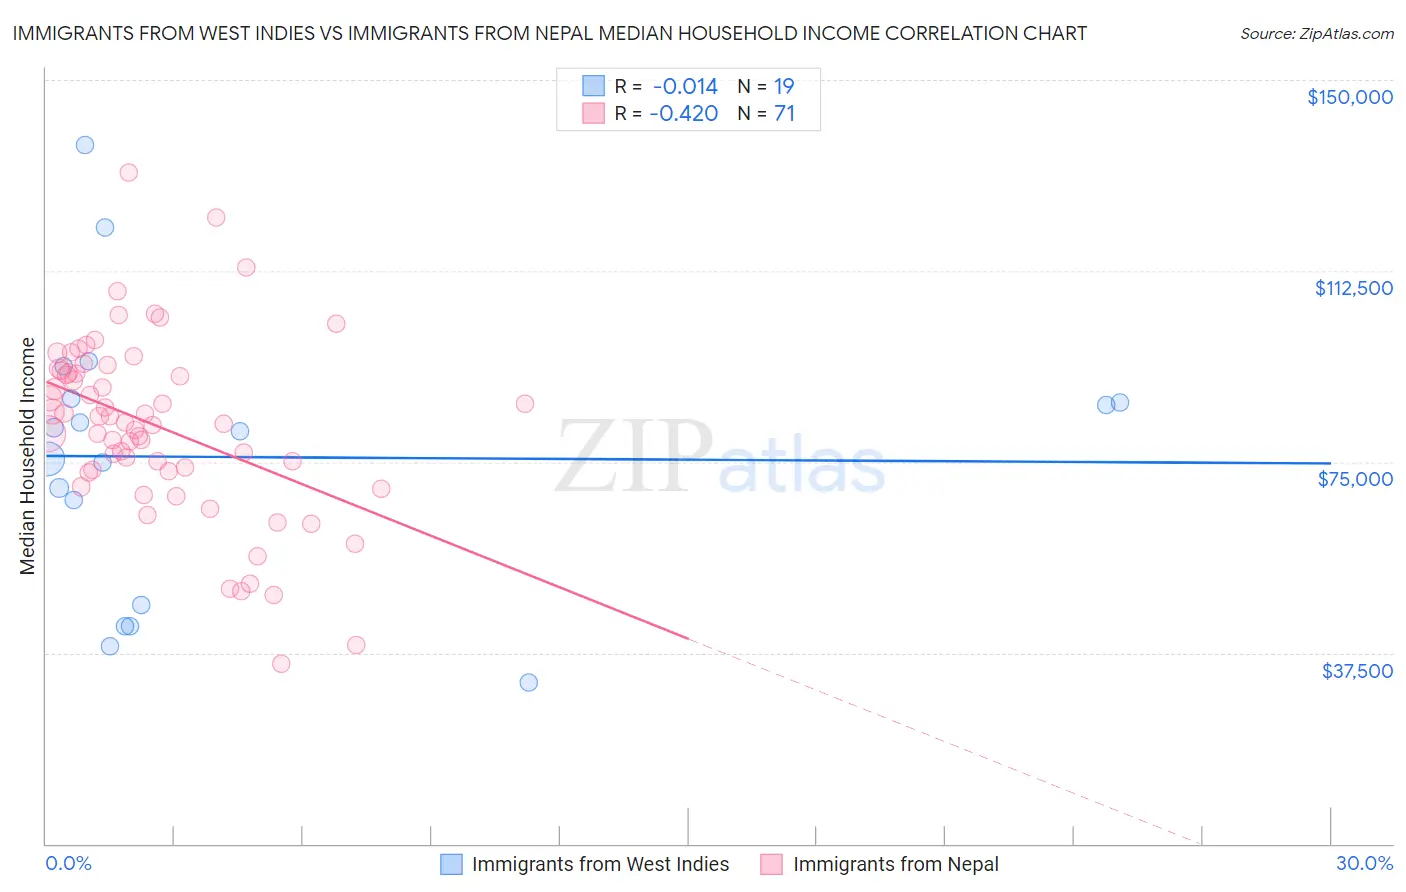
Immigrants from West Indies vs Immigrants from Nepal Median Household Income Correlation Chart
The statistical analysis conducted on geographies consisting of 72,454,628 people shows no correlation between the proportion of Immigrants from West Indies and median household income in the United States with a correlation coefficient (R) of -0.014 and weighted average of $77,956. Similarly, the statistical analysis conducted on geographies consisting of 186,662,148 people shows a moderate negative correlation between the proportion of Immigrants from Nepal and median household income in the United States with a correlation coefficient (R) of -0.420 and weighted average of $87,046, a difference of 11.7%.
Median Household Income Correlation Summary
| Measurement | Immigrants from West Indies | Immigrants from Nepal |
| Minimum | $31,731 | $35,329 |
| Maximum | $137,182 | $131,777 |
| Range | $105,451 | $96,448 |
| Mean | $75,944 | $81,976 |
| Median | $81,103 | $82,737 |
| Interquartile 25% (IQ1) | $46,875 | $73,125 |
| Interquartile 75% (IQ3) | $87,404 | $92,873 |
| Interquartile Range (IQR) | $40,529 | $19,748 |
| Standard Deviation (Sample) | $27,297 | $17,803 |
| Standard Deviation (Population) | $26,569 | $17,677 |
Similar Demographics by Median Household Income
Demographics Similar to Immigrants from West Indies by Median Household Income
In terms of median household income, the demographic groups most similar to Immigrants from West Indies are Mexican American Indian ($78,166, a difference of 0.27%), Immigrants from St. Vincent and the Grenadines ($77,690, a difference of 0.34%), Subsaharan African ($77,631, a difference of 0.42%), Immigrants from Laos ($78,327, a difference of 0.48%), and Immigrants from Middle Africa ($77,559, a difference of 0.51%).
| Demographics | Rating | Rank | Median Household Income |
| Inupiat | 1.8 /100 | #245 | Tragic $78,841 |
| Central Americans | 1.7 /100 | #246 | Tragic $78,803 |
| Immigrants | Burma/Myanmar | 1.6 /100 | #247 | Tragic $78,682 |
| Sudanese | 1.5 /100 | #248 | Tragic $78,529 |
| West Indians | 1.4 /100 | #249 | Tragic $78,455 |
| Immigrants | Laos | 1.3 /100 | #250 | Tragic $78,327 |
| Mexican American Indians | 1.2 /100 | #251 | Tragic $78,166 |
| Immigrants | West Indies | 1.0 /100 | #252 | Tragic $77,956 |
| Immigrants | St. Vincent and the Grenadines | 0.9 /100 | #253 | Tragic $77,690 |
| Sub-Saharan Africans | 0.8 /100 | #254 | Tragic $77,631 |
| Immigrants | Middle Africa | 0.8 /100 | #255 | Tragic $77,559 |
| Belizeans | 0.6 /100 | #256 | Tragic $77,028 |
| Immigrants | Senegal | 0.5 /100 | #257 | Tragic $76,915 |
| Immigrants | Nicaragua | 0.5 /100 | #258 | Tragic $76,784 |
| Spanish American Indians | 0.4 /100 | #259 | Tragic $76,670 |
Demographics Similar to Immigrants from Nepal by Median Household Income
In terms of median household income, the demographic groups most similar to Immigrants from Nepal are Basque ($87,001, a difference of 0.050%), Hungarian ($86,920, a difference of 0.15%), Immigrants from Saudi Arabia ($86,875, a difference of 0.20%), Costa Rican ($87,262, a difference of 0.25%), and South American ($86,824, a difference of 0.26%).
| Demographics | Rating | Rank | Median Household Income |
| Canadians | 84.7 /100 | #142 | Excellent $87,769 |
| Danes | 83.9 /100 | #143 | Excellent $87,676 |
| Serbians | 83.0 /100 | #144 | Excellent $87,572 |
| Ugandans | 82.9 /100 | #145 | Excellent $87,557 |
| Immigrants | Uganda | 82.8 /100 | #146 | Excellent $87,553 |
| South American Indians | 81.8 /100 | #147 | Excellent $87,446 |
| Costa Ricans | 80.0 /100 | #148 | Excellent $87,262 |
| Immigrants | Nepal | 77.7 /100 | #149 | Good $87,046 |
| Basques | 77.2 /100 | #150 | Good $87,001 |
| Hungarians | 76.3 /100 | #151 | Good $86,920 |
| Immigrants | Saudi Arabia | 75.8 /100 | #152 | Good $86,875 |
| South Americans | 75.1 /100 | #153 | Good $86,824 |
| Immigrants | Germany | 74.4 /100 | #154 | Good $86,764 |
| Carpatho Rusyns | 72.8 /100 | #155 | Good $86,635 |
| Immigrants | Albania | 71.5 /100 | #156 | Good $86,534 |