Finnish vs Immigrants from Nepal Median Household Income
COMPARE
Finnish
Immigrants from Nepal
Median Household Income
Median Household Income Comparison
Finns
Immigrants from Nepal
$83,607
MEDIAN HOUSEHOLD INCOME
27.7/ 100
METRIC RATING
193rd/ 347
METRIC RANK
$87,046
MEDIAN HOUSEHOLD INCOME
77.7/ 100
METRIC RATING
149th/ 347
METRIC RANK
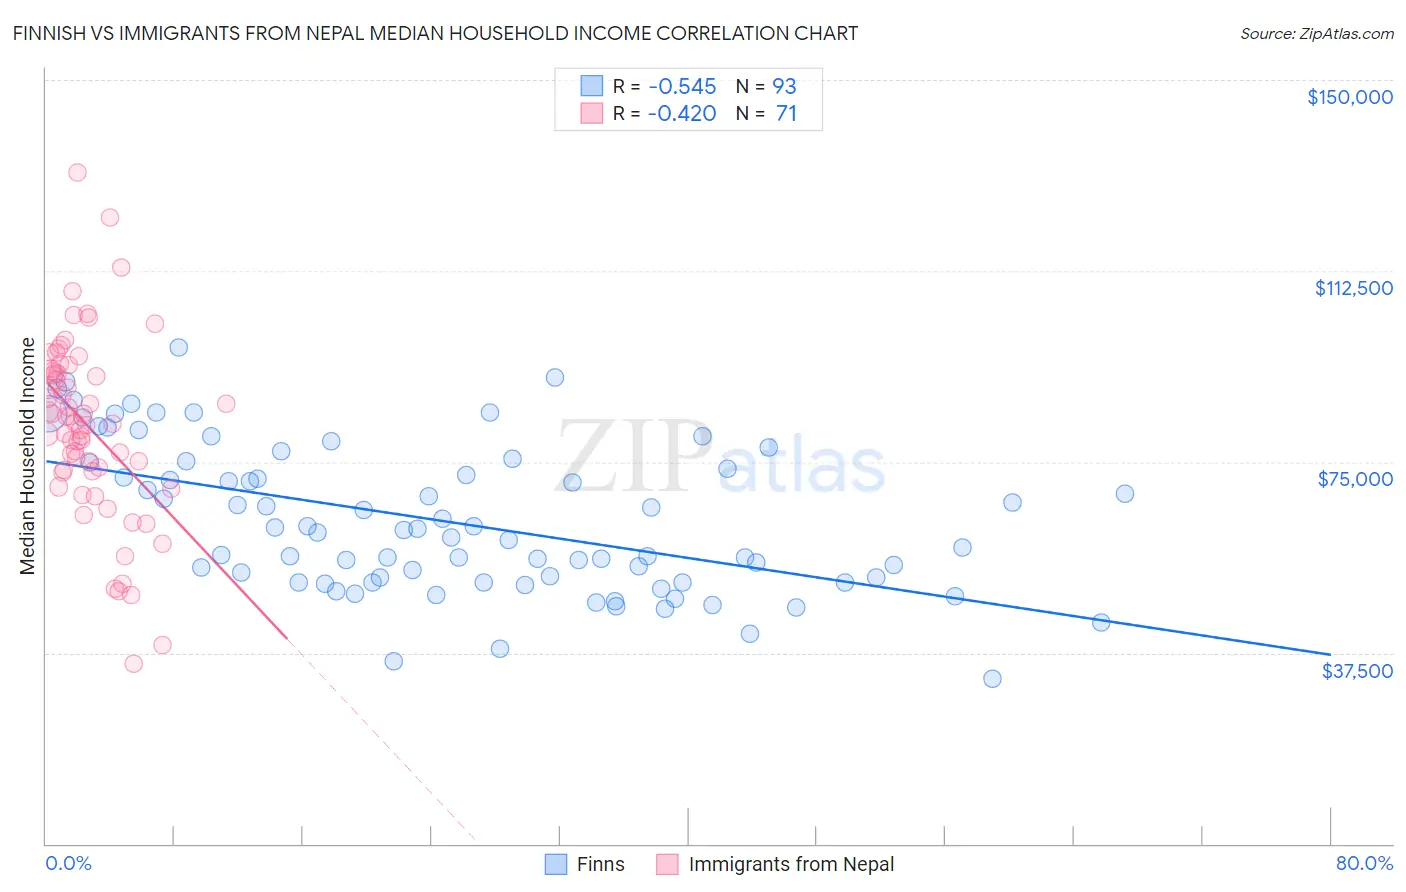
Finnish vs Immigrants from Nepal Median Household Income Correlation Chart
The statistical analysis conducted on geographies consisting of 404,464,617 people shows a substantial negative correlation between the proportion of Finns and median household income in the United States with a correlation coefficient (R) of -0.545 and weighted average of $83,607. Similarly, the statistical analysis conducted on geographies consisting of 186,662,148 people shows a moderate negative correlation between the proportion of Immigrants from Nepal and median household income in the United States with a correlation coefficient (R) of -0.420 and weighted average of $87,046, a difference of 4.1%.
Median Household Income Correlation Summary
| Measurement | Finnish | Immigrants from Nepal |
| Minimum | $32,321 | $35,329 |
| Maximum | $97,373 | $131,777 |
| Range | $65,052 | $96,448 |
| Mean | $63,204 | $81,976 |
| Median | $61,019 | $82,737 |
| Interquartile 25% (IQ1) | $51,350 | $73,125 |
| Interquartile 75% (IQ3) | $74,285 | $92,873 |
| Interquartile Range (IQR) | $22,935 | $19,748 |
| Standard Deviation (Sample) | $14,392 | $17,803 |
| Standard Deviation (Population) | $14,315 | $17,677 |
Similar Demographics by Median Household Income
Demographics Similar to Finns by Median Household Income
In terms of median household income, the demographic groups most similar to Finns are Welsh ($83,628, a difference of 0.030%), Ghanaian ($83,582, a difference of 0.030%), Immigrants from Armenia ($83,555, a difference of 0.060%), French ($83,468, a difference of 0.17%), and Iraqi ($83,753, a difference of 0.18%).
| Demographics | Rating | Rank | Median Household Income |
| Puget Sound Salish | 33.2 /100 | #186 | Fair $84,011 |
| Belgians | 33.2 /100 | #187 | Fair $84,008 |
| Tlingit-Haida | 32.6 /100 | #188 | Fair $83,968 |
| Immigrants | Colombia | 31.7 /100 | #189 | Fair $83,902 |
| Slovaks | 30.2 /100 | #190 | Fair $83,798 |
| Iraqis | 29.6 /100 | #191 | Fair $83,753 |
| Welsh | 28.0 /100 | #192 | Fair $83,628 |
| Finns | 27.7 /100 | #193 | Fair $83,607 |
| Ghanaians | 27.4 /100 | #194 | Fair $83,582 |
| Immigrants | Armenia | 27.0 /100 | #195 | Fair $83,555 |
| French | 26.0 /100 | #196 | Fair $83,468 |
| Aleuts | 25.7 /100 | #197 | Fair $83,446 |
| Japanese | 25.1 /100 | #198 | Fair $83,395 |
| Germans | 24.6 /100 | #199 | Fair $83,358 |
| Tsimshian | 24.5 /100 | #200 | Fair $83,346 |
Demographics Similar to Immigrants from Nepal by Median Household Income
In terms of median household income, the demographic groups most similar to Immigrants from Nepal are Basque ($87,001, a difference of 0.050%), Hungarian ($86,920, a difference of 0.15%), Immigrants from Saudi Arabia ($86,875, a difference of 0.20%), Costa Rican ($87,262, a difference of 0.25%), and South American ($86,824, a difference of 0.26%).
| Demographics | Rating | Rank | Median Household Income |
| Canadians | 84.7 /100 | #142 | Excellent $87,769 |
| Danes | 83.9 /100 | #143 | Excellent $87,676 |
| Serbians | 83.0 /100 | #144 | Excellent $87,572 |
| Ugandans | 82.9 /100 | #145 | Excellent $87,557 |
| Immigrants | Uganda | 82.8 /100 | #146 | Excellent $87,553 |
| South American Indians | 81.8 /100 | #147 | Excellent $87,446 |
| Costa Ricans | 80.0 /100 | #148 | Excellent $87,262 |
| Immigrants | Nepal | 77.7 /100 | #149 | Good $87,046 |
| Basques | 77.2 /100 | #150 | Good $87,001 |
| Hungarians | 76.3 /100 | #151 | Good $86,920 |
| Immigrants | Saudi Arabia | 75.8 /100 | #152 | Good $86,875 |
| South Americans | 75.1 /100 | #153 | Good $86,824 |
| Immigrants | Germany | 74.4 /100 | #154 | Good $86,764 |
| Carpatho Rusyns | 72.8 /100 | #155 | Good $86,635 |
| Immigrants | Albania | 71.5 /100 | #156 | Good $86,534 |