Black/African American vs Chippewa Median Family Income
COMPARE
Black/African American
Chippewa
Median Family Income
Median Family Income Comparison
Blacks/African Americans
Chippewa
$81,912
MEDIAN FAMILY INCOME
0.0/ 100
METRIC RATING
328th/ 347
METRIC RANK
$86,852
MEDIAN FAMILY INCOME
0.0/ 100
METRIC RATING
299th/ 347
METRIC RANK
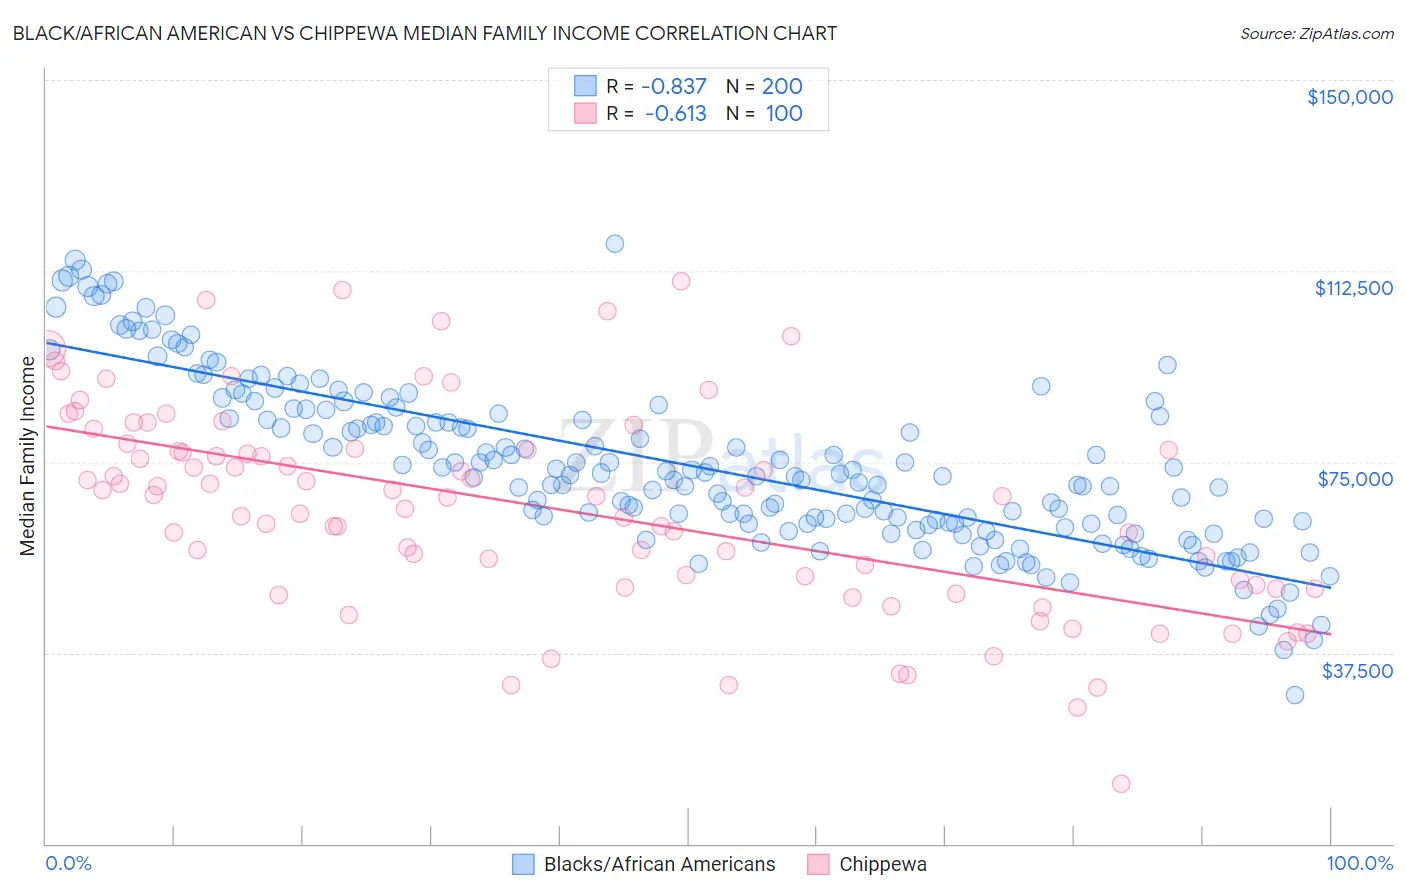
Black/African American vs Chippewa Median Family Income Correlation Chart
The statistical analysis conducted on geographies consisting of 564,544,060 people shows a very strong negative correlation between the proportion of Blacks/African Americans and median family income in the United States with a correlation coefficient (R) of -0.837 and weighted average of $81,912. Similarly, the statistical analysis conducted on geographies consisting of 214,970,726 people shows a significant negative correlation between the proportion of Chippewa and median family income in the United States with a correlation coefficient (R) of -0.613 and weighted average of $86,852, a difference of 6.0%.
Median Family Income Correlation Summary
| Measurement | Black/African American | Chippewa |
| Minimum | $29,315 | $11,667 |
| Maximum | $117,822 | $110,455 |
| Range | $88,507 | $98,788 |
| Mean | $74,336 | $65,965 |
| Median | $72,335 | $68,273 |
| Interquartile 25% (IQ1) | $62,832 | $50,598 |
| Interquartile 75% (IQ3) | $85,289 | $77,379 |
| Interquartile Range (IQR) | $22,457 | $26,781 |
| Standard Deviation (Sample) | $16,637 | $20,173 |
| Standard Deviation (Population) | $16,596 | $20,072 |
Similar Demographics by Median Family Income
Demographics Similar to Blacks/African Americans by Median Family Income
In terms of median family income, the demographic groups most similar to Blacks/African Americans are Dutch West Indian ($81,852, a difference of 0.070%), Arapaho ($82,064, a difference of 0.18%), Immigrants from Congo ($82,216, a difference of 0.37%), Sioux ($82,386, a difference of 0.58%), and Cheyenne ($81,385, a difference of 0.65%).
| Demographics | Rating | Rank | Median Family Income |
| Immigrants | Caribbean | 0.0 /100 | #321 | Tragic $83,319 |
| Dominicans | 0.0 /100 | #322 | Tragic $82,888 |
| Bahamians | 0.0 /100 | #323 | Tragic $82,631 |
| Creek | 0.0 /100 | #324 | Tragic $82,560 |
| Sioux | 0.0 /100 | #325 | Tragic $82,386 |
| Immigrants | Congo | 0.0 /100 | #326 | Tragic $82,216 |
| Arapaho | 0.0 /100 | #327 | Tragic $82,064 |
| Blacks/African Americans | 0.0 /100 | #328 | Tragic $81,912 |
| Dutch West Indians | 0.0 /100 | #329 | Tragic $81,852 |
| Cheyenne | 0.0 /100 | #330 | Tragic $81,385 |
| Immigrants | Dominican Republic | 0.0 /100 | #331 | Tragic $81,233 |
| Natives/Alaskans | 0.0 /100 | #332 | Tragic $80,908 |
| Kiowa | 0.0 /100 | #333 | Tragic $80,885 |
| Menominee | 0.0 /100 | #334 | Tragic $79,563 |
| Yup'ik | 0.0 /100 | #335 | Tragic $79,290 |
Demographics Similar to Chippewa by Median Family Income
In terms of median family income, the demographic groups most similar to Chippewa are Immigrants from Latin America ($86,989, a difference of 0.16%), Cajun ($87,157, a difference of 0.35%), Immigrants from Guatemala ($87,191, a difference of 0.39%), Yaqui ($87,289, a difference of 0.50%), and Ottawa ($86,380, a difference of 0.55%).
| Demographics | Rating | Rank | Median Family Income |
| Africans | 0.1 /100 | #292 | Tragic $87,820 |
| Ute | 0.0 /100 | #293 | Tragic $87,596 |
| Fijians | 0.0 /100 | #294 | Tragic $87,387 |
| Yaqui | 0.0 /100 | #295 | Tragic $87,289 |
| Immigrants | Guatemala | 0.0 /100 | #296 | Tragic $87,191 |
| Cajuns | 0.0 /100 | #297 | Tragic $87,157 |
| Immigrants | Latin America | 0.0 /100 | #298 | Tragic $86,989 |
| Chippewa | 0.0 /100 | #299 | Tragic $86,852 |
| Ottawa | 0.0 /100 | #300 | Tragic $86,380 |
| Colville | 0.0 /100 | #301 | Tragic $85,792 |
| Spanish American Indians | 0.0 /100 | #302 | Tragic $85,728 |
| Hispanics or Latinos | 0.0 /100 | #303 | Tragic $85,647 |
| Mexicans | 0.0 /100 | #304 | Tragic $85,618 |
| Paiute | 0.0 /100 | #305 | Tragic $85,414 |
| Immigrants | Dominica | 0.0 /100 | #306 | Tragic $85,411 |