Black/African American vs Immigrants from Switzerland Median Family Income
COMPARE
Black/African American
Immigrants from Switzerland
Median Family Income
Median Family Income Comparison
Blacks/African Americans
Immigrants from Switzerland
$81,912
MEDIAN FAMILY INCOME
0.0/ 100
METRIC RATING
328th/ 347
METRIC RANK
$120,726
MEDIAN FAMILY INCOME
100.0/ 100
METRIC RATING
26th/ 347
METRIC RANK
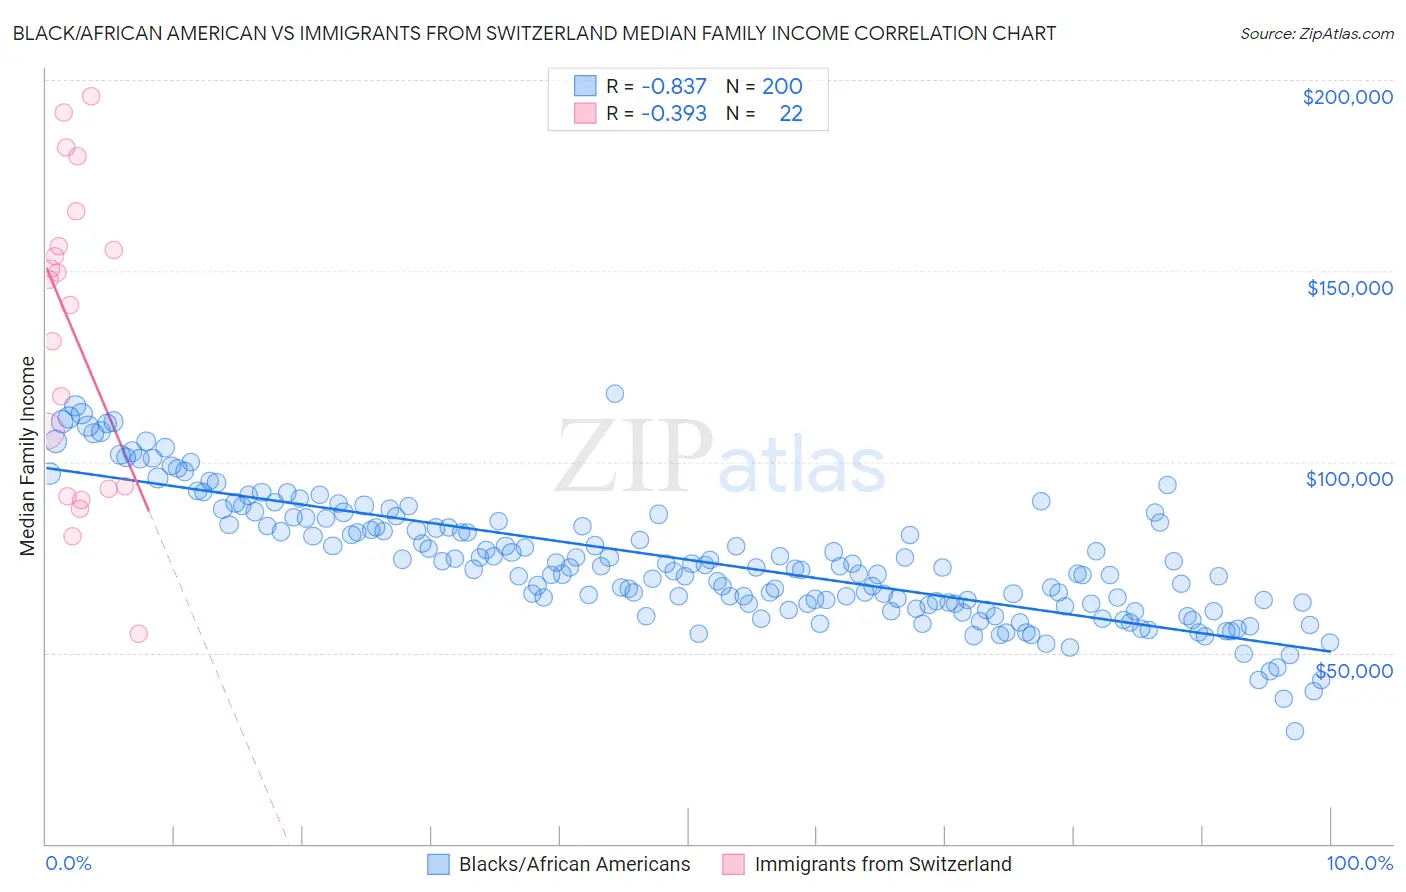
Black/African American vs Immigrants from Switzerland Median Family Income Correlation Chart
The statistical analysis conducted on geographies consisting of 564,544,060 people shows a very strong negative correlation between the proportion of Blacks/African Americans and median family income in the United States with a correlation coefficient (R) of -0.837 and weighted average of $81,912. Similarly, the statistical analysis conducted on geographies consisting of 148,050,158 people shows a mild negative correlation between the proportion of Immigrants from Switzerland and median family income in the United States with a correlation coefficient (R) of -0.393 and weighted average of $120,726, a difference of 47.4%.
Median Family Income Correlation Summary
| Measurement | Black/African American | Immigrants from Switzerland |
| Minimum | $29,315 | $55,000 |
| Maximum | $117,822 | $195,586 |
| Range | $88,507 | $140,586 |
| Mean | $74,336 | $132,599 |
| Median | $72,335 | $144,292 |
| Interquartile 25% (IQ1) | $62,832 | $92,813 |
| Interquartile 75% (IQ3) | $85,289 | $156,420 |
| Interquartile Range (IQR) | $22,457 | $63,607 |
| Standard Deviation (Sample) | $16,637 | $40,204 |
| Standard Deviation (Population) | $16,596 | $39,280 |
Similar Demographics by Median Family Income
Demographics Similar to Blacks/African Americans by Median Family Income
In terms of median family income, the demographic groups most similar to Blacks/African Americans are Dutch West Indian ($81,852, a difference of 0.070%), Arapaho ($82,064, a difference of 0.18%), Immigrants from Congo ($82,216, a difference of 0.37%), Sioux ($82,386, a difference of 0.58%), and Cheyenne ($81,385, a difference of 0.65%).
| Demographics | Rating | Rank | Median Family Income |
| Immigrants | Caribbean | 0.0 /100 | #321 | Tragic $83,319 |
| Dominicans | 0.0 /100 | #322 | Tragic $82,888 |
| Bahamians | 0.0 /100 | #323 | Tragic $82,631 |
| Creek | 0.0 /100 | #324 | Tragic $82,560 |
| Sioux | 0.0 /100 | #325 | Tragic $82,386 |
| Immigrants | Congo | 0.0 /100 | #326 | Tragic $82,216 |
| Arapaho | 0.0 /100 | #327 | Tragic $82,064 |
| Blacks/African Americans | 0.0 /100 | #328 | Tragic $81,912 |
| Dutch West Indians | 0.0 /100 | #329 | Tragic $81,852 |
| Cheyenne | 0.0 /100 | #330 | Tragic $81,385 |
| Immigrants | Dominican Republic | 0.0 /100 | #331 | Tragic $81,233 |
| Natives/Alaskans | 0.0 /100 | #332 | Tragic $80,908 |
| Kiowa | 0.0 /100 | #333 | Tragic $80,885 |
| Menominee | 0.0 /100 | #334 | Tragic $79,563 |
| Yup'ik | 0.0 /100 | #335 | Tragic $79,290 |
Demographics Similar to Immigrants from Switzerland by Median Family Income
In terms of median family income, the demographic groups most similar to Immigrants from Switzerland are Russian ($120,487, a difference of 0.20%), Immigrants from Denmark ($120,445, a difference of 0.23%), Latvian ($120,301, a difference of 0.35%), Turkish ($121,202, a difference of 0.39%), and Immigrants from Sri Lanka ($120,263, a difference of 0.39%).
| Demographics | Rating | Rank | Median Family Income |
| Immigrants | Belgium | 100.0 /100 | #19 | Exceptional $123,831 |
| Burmese | 100.0 /100 | #20 | Exceptional $123,369 |
| Immigrants | Korea | 100.0 /100 | #21 | Exceptional $122,800 |
| Immigrants | Sweden | 100.0 /100 | #22 | Exceptional $122,765 |
| Immigrants | Japan | 100.0 /100 | #23 | Exceptional $122,764 |
| Immigrants | Northern Europe | 100.0 /100 | #24 | Exceptional $121,840 |
| Turks | 100.0 /100 | #25 | Exceptional $121,202 |
| Immigrants | Switzerland | 100.0 /100 | #26 | Exceptional $120,726 |
| Russians | 100.0 /100 | #27 | Exceptional $120,487 |
| Immigrants | Denmark | 100.0 /100 | #28 | Exceptional $120,445 |
| Latvians | 100.0 /100 | #29 | Exceptional $120,301 |
| Immigrants | Sri Lanka | 100.0 /100 | #30 | Exceptional $120,263 |
| Immigrants | France | 100.0 /100 | #31 | Exceptional $120,076 |
| Asians | 100.0 /100 | #32 | Exceptional $119,955 |
| Bhutanese | 100.0 /100 | #33 | Exceptional $119,800 |