Immigrants from Singapore vs Immigrants from Mexico Median Family Income
COMPARE
Immigrants from Singapore
Immigrants from Mexico
Median Family Income
Median Family Income Comparison
Immigrants from Singapore
Immigrants from Mexico
$134,818
MEDIAN FAMILY INCOME
100.0/ 100
METRIC RATING
3rd/ 347
METRIC RANK
$83,639
MEDIAN FAMILY INCOME
0.0/ 100
METRIC RATING
318th/ 347
METRIC RANK
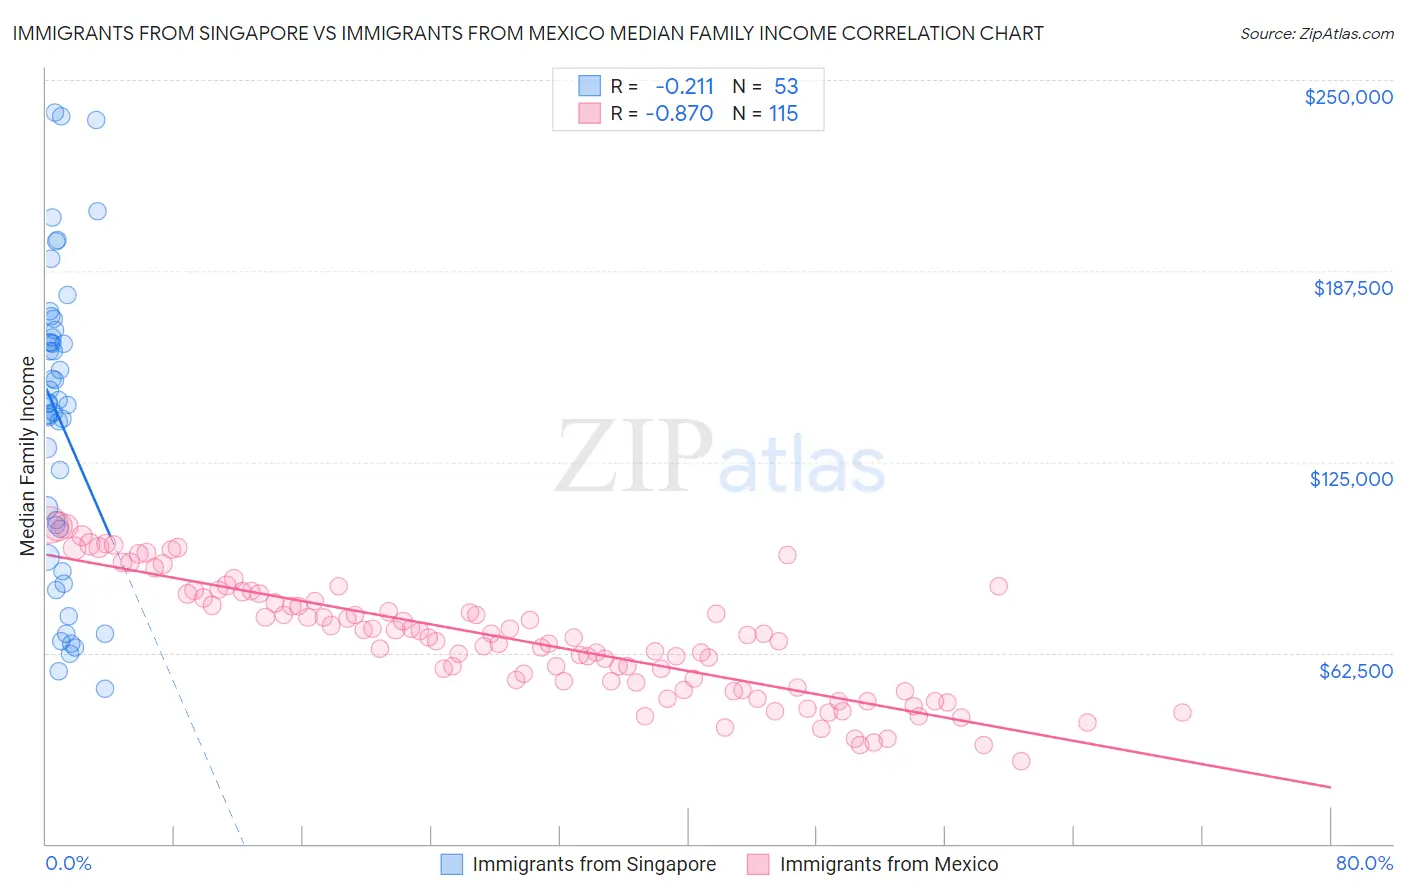
Immigrants from Singapore vs Immigrants from Mexico Median Family Income Correlation Chart
The statistical analysis conducted on geographies consisting of 137,416,913 people shows a weak negative correlation between the proportion of Immigrants from Singapore and median family income in the United States with a correlation coefficient (R) of -0.211 and weighted average of $134,818. Similarly, the statistical analysis conducted on geographies consisting of 512,958,720 people shows a very strong negative correlation between the proportion of Immigrants from Mexico and median family income in the United States with a correlation coefficient (R) of -0.870 and weighted average of $83,639, a difference of 61.2%.
Median Family Income Correlation Summary
| Measurement | Immigrants from Singapore | Immigrants from Mexico |
| Minimum | $50,694 | $27,125 |
| Maximum | $239,159 | $104,446 |
| Range | $188,465 | $77,321 |
| Mean | $138,690 | $66,857 |
| Median | $144,010 | $67,328 |
| Interquartile 25% (IQ1) | $98,407 | $51,313 |
| Interquartile 75% (IQ3) | $166,932 | $80,504 |
| Interquartile Range (IQR) | $68,525 | $29,191 |
| Standard Deviation (Sample) | $49,034 | $19,043 |
| Standard Deviation (Population) | $48,569 | $18,960 |
Similar Demographics by Median Family Income
Demographics Similar to Immigrants from Singapore by Median Family Income
In terms of median family income, the demographic groups most similar to Immigrants from Singapore are Immigrants from India ($134,028, a difference of 0.59%), Iranian ($133,839, a difference of 0.73%), Immigrants from Taiwan ($136,949, a difference of 1.6%), Filipino ($138,397, a difference of 2.6%), and Thai ($131,281, a difference of 2.7%).
| Demographics | Rating | Rank | Median Family Income |
| Filipinos | 100.0 /100 | #1 | Exceptional $138,397 |
| Immigrants | Taiwan | 100.0 /100 | #2 | Exceptional $136,949 |
| Immigrants | Singapore | 100.0 /100 | #3 | Exceptional $134,818 |
| Immigrants | India | 100.0 /100 | #4 | Exceptional $134,028 |
| Iranians | 100.0 /100 | #5 | Exceptional $133,839 |
| Thais | 100.0 /100 | #6 | Exceptional $131,281 |
| Immigrants | Hong Kong | 100.0 /100 | #7 | Exceptional $131,067 |
| Immigrants | Iran | 100.0 /100 | #8 | Exceptional $130,894 |
| Okinawans | 100.0 /100 | #9 | Exceptional $129,979 |
| Immigrants | Ireland | 100.0 /100 | #10 | Exceptional $127,584 |
| Immigrants | Israel | 100.0 /100 | #11 | Exceptional $127,430 |
| Cypriots | 100.0 /100 | #12 | Exceptional $127,064 |
| Immigrants | Australia | 100.0 /100 | #13 | Exceptional $126,620 |
| Immigrants | South Central Asia | 100.0 /100 | #14 | Exceptional $125,956 |
| Eastern Europeans | 100.0 /100 | #15 | Exceptional $125,546 |
Demographics Similar to Immigrants from Mexico by Median Family Income
In terms of median family income, the demographic groups most similar to Immigrants from Mexico are Immigrants from Honduras ($83,618, a difference of 0.030%), Seminole ($83,354, a difference of 0.34%), Yakama ($83,932, a difference of 0.35%), Immigrants from Caribbean ($83,319, a difference of 0.38%), and Immigrants from Haiti ($84,018, a difference of 0.45%).
| Demographics | Rating | Rank | Median Family Income |
| Hondurans | 0.0 /100 | #311 | Tragic $85,004 |
| Cubans | 0.0 /100 | #312 | Tragic $84,981 |
| Choctaw | 0.0 /100 | #313 | Tragic $84,835 |
| Immigrants | Bahamas | 0.0 /100 | #314 | Tragic $84,732 |
| Apache | 0.0 /100 | #315 | Tragic $84,451 |
| Immigrants | Haiti | 0.0 /100 | #316 | Tragic $84,018 |
| Yakama | 0.0 /100 | #317 | Tragic $83,932 |
| Immigrants | Mexico | 0.0 /100 | #318 | Tragic $83,639 |
| Immigrants | Honduras | 0.0 /100 | #319 | Tragic $83,618 |
| Seminole | 0.0 /100 | #320 | Tragic $83,354 |
| Immigrants | Caribbean | 0.0 /100 | #321 | Tragic $83,319 |
| Dominicans | 0.0 /100 | #322 | Tragic $82,888 |
| Bahamians | 0.0 /100 | #323 | Tragic $82,631 |
| Creek | 0.0 /100 | #324 | Tragic $82,560 |
| Sioux | 0.0 /100 | #325 | Tragic $82,386 |