Black/African American vs Immigrants from Caribbean 3rd Grade
COMPARE
Black/African American
Immigrants from Caribbean
3rd Grade
3rd Grade Comparison
Blacks/African Americans
Immigrants from Caribbean
97.7%
3RD GRADE
29.6/ 100
METRIC RATING
191st/ 347
METRIC RANK
96.7%
3RD GRADE
0.0/ 100
METRIC RATING
304th/ 347
METRIC RANK
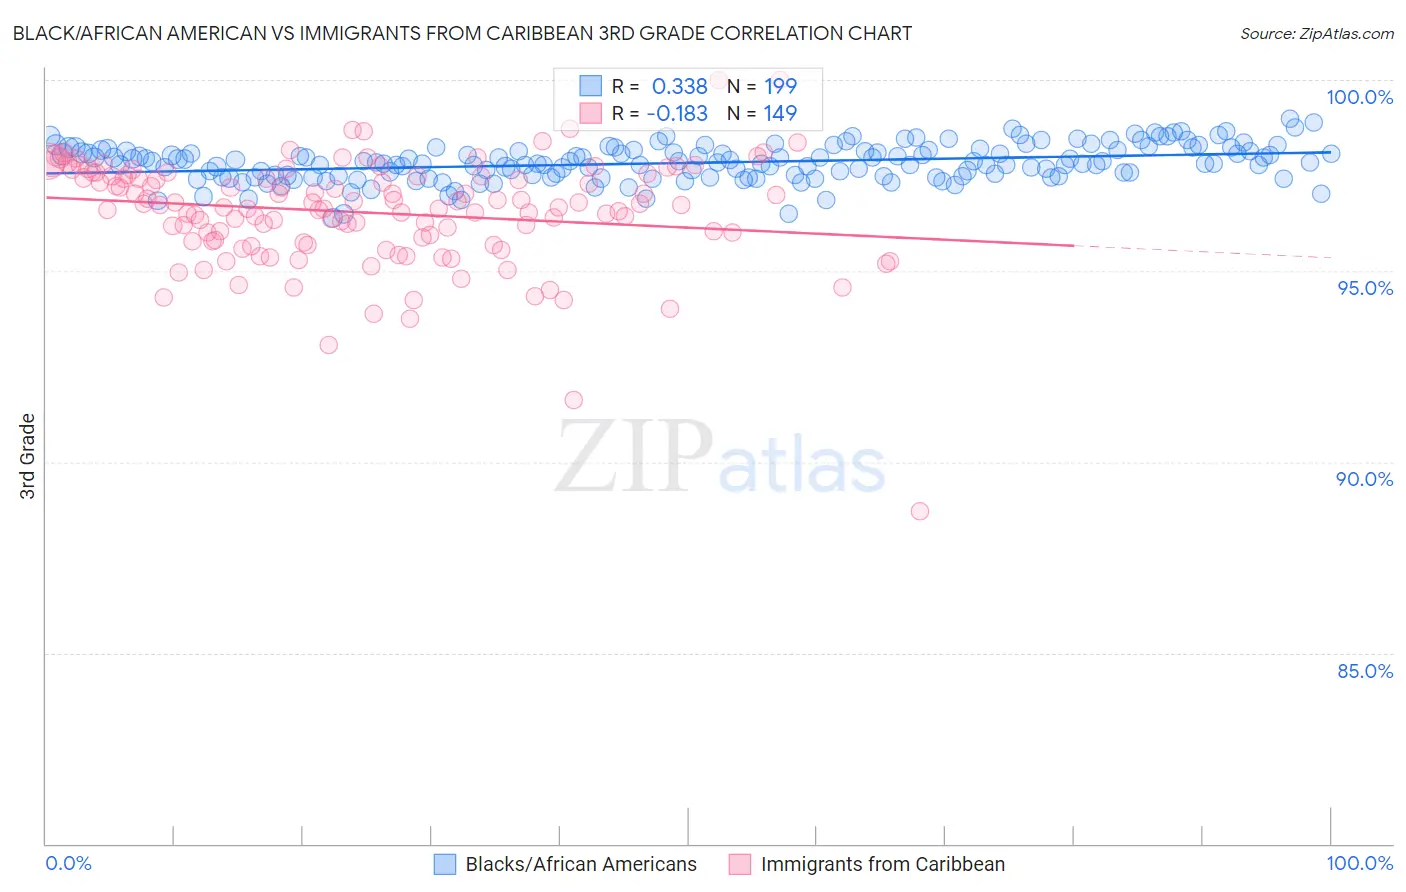
Black/African American vs Immigrants from Caribbean 3rd Grade Correlation Chart
The statistical analysis conducted on geographies consisting of 566,043,750 people shows a mild positive correlation between the proportion of Blacks/African Americans and percentage of population with at least 3rd grade education in the United States with a correlation coefficient (R) of 0.338 and weighted average of 97.7%. Similarly, the statistical analysis conducted on geographies consisting of 450,065,262 people shows a poor negative correlation between the proportion of Immigrants from Caribbean and percentage of population with at least 3rd grade education in the United States with a correlation coefficient (R) of -0.183 and weighted average of 96.7%, a difference of 0.99%.
3rd Grade Correlation Summary
| Measurement | Black/African American | Immigrants from Caribbean |
| Minimum | 96.4% | 88.7% |
| Maximum | 99.0% | 100.0% |
| Range | 2.6% | 11.3% |
| Mean | 97.8% | 96.5% |
| Median | 97.8% | 96.7% |
| Interquartile 25% (IQ1) | 97.5% | 95.8% |
| Interquartile 75% (IQ3) | 98.1% | 97.5% |
| Interquartile Range (IQR) | 0.67% | 1.7% |
| Standard Deviation (Sample) | 0.47% | 1.4% |
| Standard Deviation (Population) | 0.47% | 1.4% |
Similar Demographics by 3rd Grade
Demographics Similar to Blacks/African Americans by 3rd Grade
In terms of 3rd grade, the demographic groups most similar to Blacks/African Americans are Mongolian (97.7%, a difference of 0.0%), Panamanian (97.7%, a difference of 0.010%), Immigrants from Kenya (97.7%, a difference of 0.010%), Immigrants from Uganda (97.7%, a difference of 0.010%), and Immigrants from Egypt (97.7%, a difference of 0.010%).
| Demographics | Rating | Rank | 3rd Grade |
| Immigrants | Kazakhstan | 37.4 /100 | #184 | Fair 97.7% |
| Immigrants | Argentina | 37.0 /100 | #185 | Fair 97.7% |
| Portuguese | 36.2 /100 | #186 | Fair 97.7% |
| Natives/Alaskans | 35.2 /100 | #187 | Fair 97.7% |
| Immigrants | Taiwan | 34.2 /100 | #188 | Fair 97.7% |
| Pakistanis | 34.2 /100 | #189 | Fair 97.7% |
| Panamanians | 31.5 /100 | #190 | Fair 97.7% |
| Blacks/African Americans | 29.6 /100 | #191 | Fair 97.7% |
| Mongolians | 29.1 /100 | #192 | Fair 97.7% |
| Immigrants | Kenya | 28.2 /100 | #193 | Fair 97.7% |
| Immigrants | Uganda | 27.4 /100 | #194 | Fair 97.7% |
| Immigrants | Egypt | 26.8 /100 | #195 | Fair 97.7% |
| Paraguayans | 26.2 /100 | #196 | Fair 97.7% |
| Hawaiians | 25.7 /100 | #197 | Fair 97.7% |
| Guamanians/Chamorros | 23.6 /100 | #198 | Fair 97.7% |
Demographics Similar to Immigrants from Caribbean by 3rd Grade
In terms of 3rd grade, the demographic groups most similar to Immigrants from Caribbean are Central American Indian (96.7%, a difference of 0.010%), Immigrants from Somalia (96.8%, a difference of 0.020%), Ecuadorian (96.7%, a difference of 0.020%), Guyanese (96.7%, a difference of 0.040%), and Nicaraguan (96.7%, a difference of 0.060%).
| Demographics | Rating | Rank | 3rd Grade |
| Haitians | 0.0 /100 | #297 | Tragic 96.9% |
| Immigrants | Dominica | 0.0 /100 | #298 | Tragic 96.9% |
| Somalis | 0.0 /100 | #299 | Tragic 96.8% |
| Immigrants | South Eastern Asia | 0.0 /100 | #300 | Tragic 96.8% |
| Immigrants | Cuba | 0.0 /100 | #301 | Tragic 96.8% |
| Immigrants | Somalia | 0.0 /100 | #302 | Tragic 96.8% |
| Ecuadorians | 0.0 /100 | #303 | Tragic 96.7% |
| Immigrants | Caribbean | 0.0 /100 | #304 | Tragic 96.7% |
| Central American Indians | 0.0 /100 | #305 | Tragic 96.7% |
| Guyanese | 0.0 /100 | #306 | Tragic 96.7% |
| Nicaraguans | 0.0 /100 | #307 | Tragic 96.7% |
| Immigrants | Haiti | 0.0 /100 | #308 | Tragic 96.7% |
| Sri Lankans | 0.0 /100 | #309 | Tragic 96.7% |
| Cape Verdeans | 0.0 /100 | #310 | Tragic 96.6% |
| Immigrants | Guyana | 0.0 /100 | #311 | Tragic 96.6% |