Black/African American vs Immigrants from Caribbean 9th Grade
COMPARE
Black/African American
Immigrants from Caribbean
9th Grade
9th Grade Comparison
Blacks/African Americans
Immigrants from Caribbean
94.6%
9TH GRADE
20.5/ 100
METRIC RATING
201st/ 347
METRIC RANK
92.2%
9TH GRADE
0.0/ 100
METRIC RATING
315th/ 347
METRIC RANK
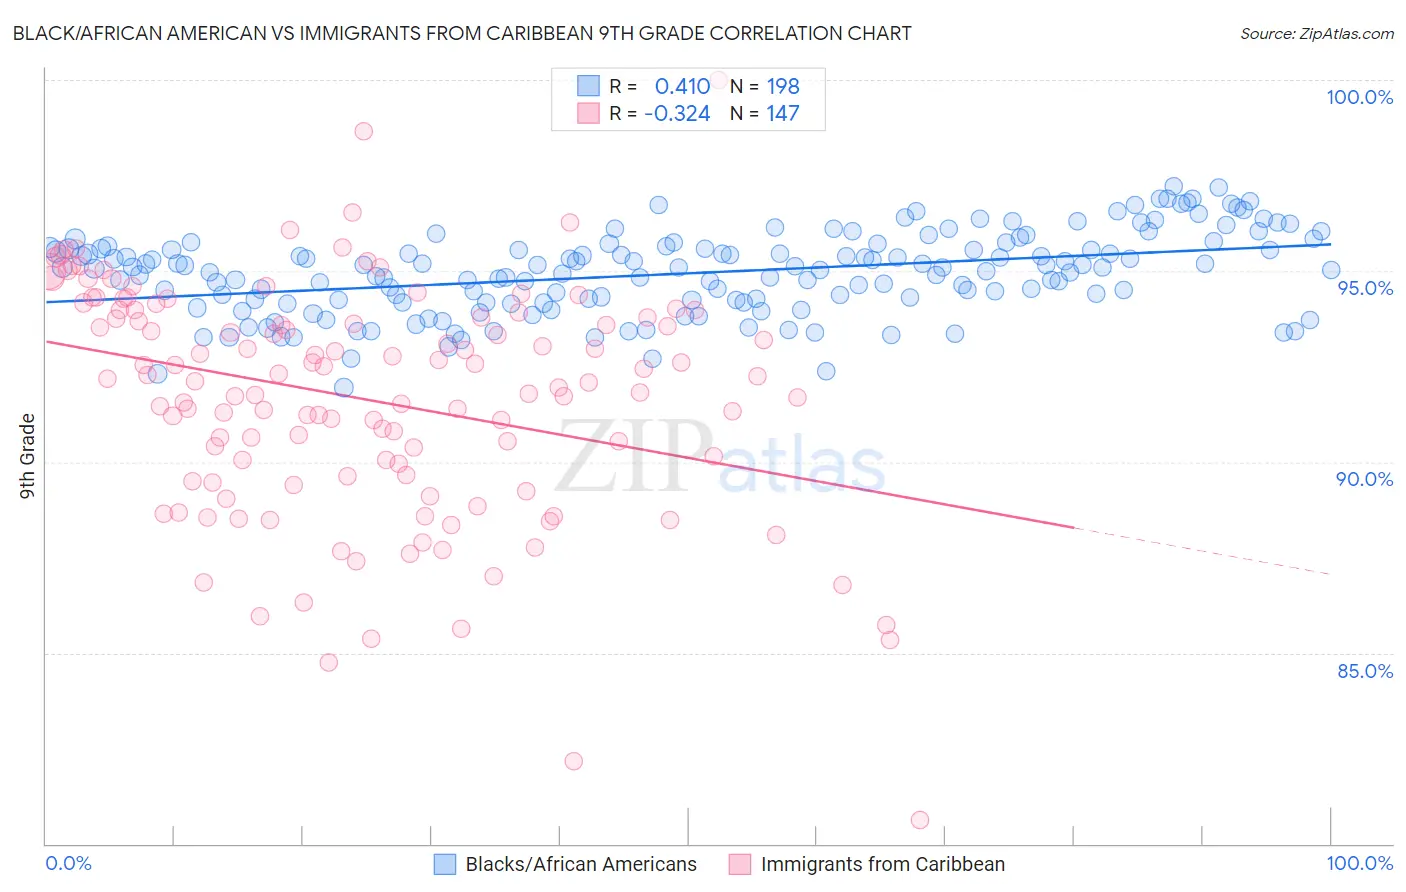
Black/African American vs Immigrants from Caribbean 9th Grade Correlation Chart
The statistical analysis conducted on geographies consisting of 561,177,282 people shows a moderate positive correlation between the proportion of Blacks/African Americans and percentage of population with at least 9th grade education in the United States with a correlation coefficient (R) of 0.410 and weighted average of 94.6%. Similarly, the statistical analysis conducted on geographies consisting of 450,064,654 people shows a mild negative correlation between the proportion of Immigrants from Caribbean and percentage of population with at least 9th grade education in the United States with a correlation coefficient (R) of -0.324 and weighted average of 92.2%, a difference of 2.6%.
9th Grade Correlation Summary
| Measurement | Black/African American | Immigrants from Caribbean |
| Minimum | 91.9% | 80.6% |
| Maximum | 97.2% | 100.0% |
| Range | 5.3% | 19.4% |
| Mean | 94.9% | 91.6% |
| Median | 95.1% | 92.1% |
| Interquartile 25% (IQ1) | 94.2% | 89.6% |
| Interquartile 75% (IQ3) | 95.6% | 93.9% |
| Interquartile Range (IQR) | 1.4% | 4.3% |
| Standard Deviation (Sample) | 1.1% | 3.1% |
| Standard Deviation (Population) | 1.1% | 3.1% |
Similar Demographics by 9th Grade
Demographics Similar to Blacks/African Americans by 9th Grade
In terms of 9th grade, the demographic groups most similar to Blacks/African Americans are Immigrants from Zaire (94.6%, a difference of 0.0%), Laotian (94.6%, a difference of 0.010%), Immigrants from Eastern Asia (94.6%, a difference of 0.010%), Immigrants from Bahamas (94.6%, a difference of 0.010%), and Moroccan (94.6%, a difference of 0.010%).
| Demographics | Rating | Rank | 9th Grade |
| Panamanians | 29.0 /100 | #194 | Fair 94.7% |
| Marshallese | 27.9 /100 | #195 | Fair 94.7% |
| Immigrants | Lebanon | 27.2 /100 | #196 | Fair 94.7% |
| Immigrants | Micronesia | 24.7 /100 | #197 | Fair 94.7% |
| Hawaiians | 22.7 /100 | #198 | Fair 94.7% |
| Laotians | 21.0 /100 | #199 | Fair 94.6% |
| Immigrants | Zaire | 20.6 /100 | #200 | Fair 94.6% |
| Blacks/African Americans | 20.5 /100 | #201 | Fair 94.6% |
| Immigrants | Eastern Asia | 19.8 /100 | #202 | Poor 94.6% |
| Immigrants | Bahamas | 19.8 /100 | #203 | Poor 94.6% |
| Moroccans | 19.6 /100 | #204 | Poor 94.6% |
| Immigrants | Sudan | 17.6 /100 | #205 | Poor 94.6% |
| Samoans | 17.3 /100 | #206 | Poor 94.6% |
| Immigrants | Morocco | 16.3 /100 | #207 | Poor 94.6% |
| Immigrants | Pakistan | 15.5 /100 | #208 | Poor 94.6% |
Demographics Similar to Immigrants from Caribbean by 9th Grade
In terms of 9th grade, the demographic groups most similar to Immigrants from Caribbean are Immigrants from Portugal (92.2%, a difference of 0.010%), Cape Verdean (92.2%, a difference of 0.040%), Vietnamese (92.3%, a difference of 0.050%), Immigrants from Cuba (92.2%, a difference of 0.050%), and Houma (92.3%, a difference of 0.070%).
| Demographics | Rating | Rank | 9th Grade |
| Immigrants | Guyana | 0.0 /100 | #308 | Tragic 92.5% |
| Immigrants | Bangladesh | 0.0 /100 | #309 | Tragic 92.4% |
| Immigrants | Cambodia | 0.0 /100 | #310 | Tragic 92.4% |
| Immigrants | Fiji | 0.0 /100 | #311 | Tragic 92.3% |
| Houma | 0.0 /100 | #312 | Tragic 92.3% |
| Vietnamese | 0.0 /100 | #313 | Tragic 92.3% |
| Immigrants | Portugal | 0.0 /100 | #314 | Tragic 92.2% |
| Immigrants | Caribbean | 0.0 /100 | #315 | Tragic 92.2% |
| Cape Verdeans | 0.0 /100 | #316 | Tragic 92.2% |
| Immigrants | Cuba | 0.0 /100 | #317 | Tragic 92.2% |
| Nepalese | 0.0 /100 | #318 | Tragic 92.0% |
| Ecuadorians | 0.0 /100 | #319 | Tragic 91.9% |
| Nicaraguans | 0.0 /100 | #320 | Tragic 91.9% |
| Immigrants | Ecuador | 0.0 /100 | #321 | Tragic 91.8% |
| Belizeans | 0.0 /100 | #322 | Tragic 91.8% |