Greek vs Ukrainian Per Capita Income
COMPARE
Greek
Ukrainian
Per Capita Income
Per Capita Income Comparison
Greeks
Ukrainians
$49,309
PER CAPITA INCOME
99.8/ 100
METRIC RATING
71st/ 347
METRIC RANK
$48,014
PER CAPITA INCOME
99.3/ 100
METRIC RATING
87th/ 347
METRIC RANK
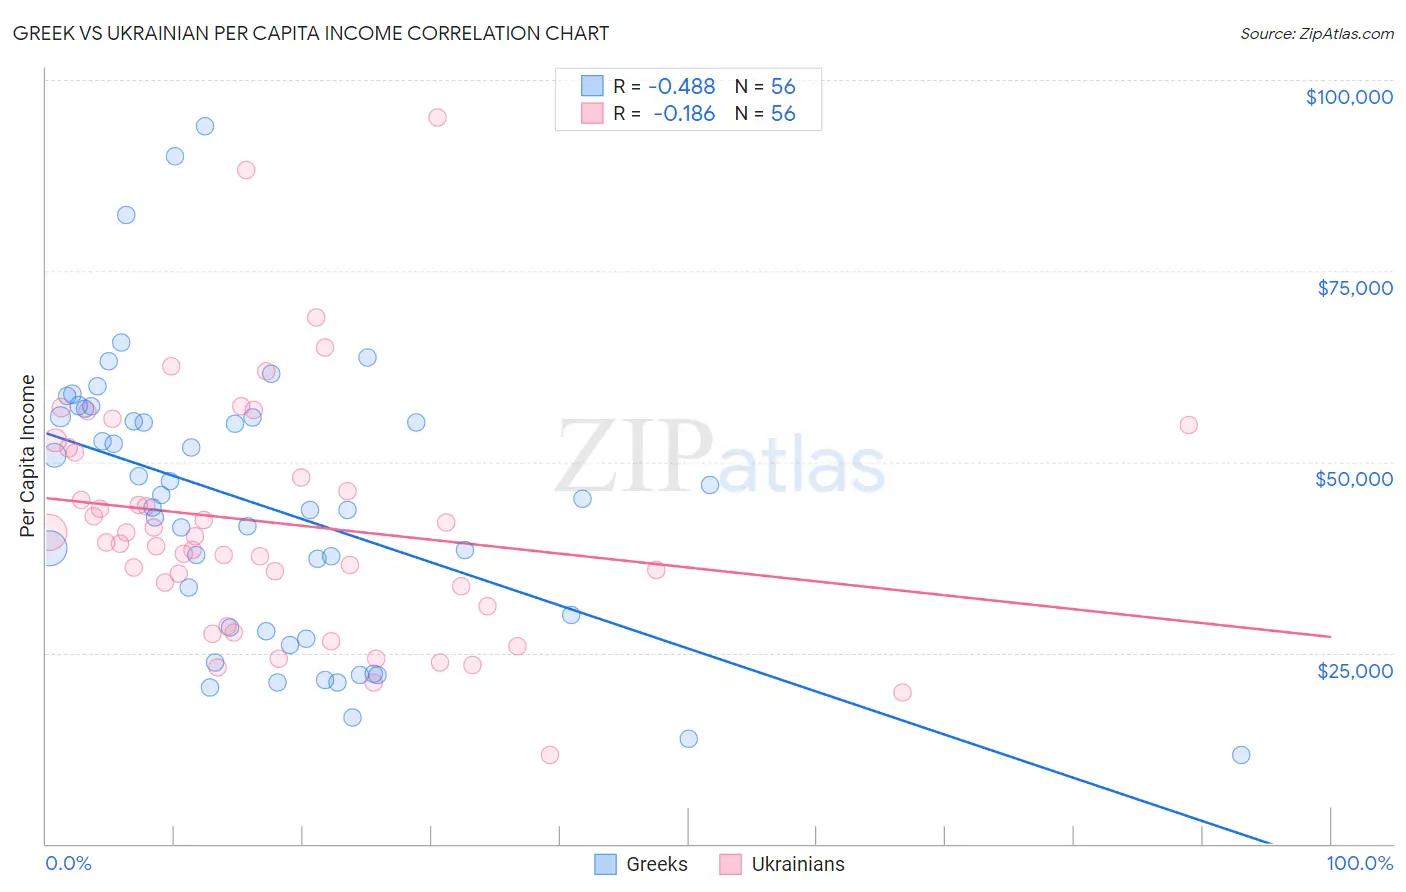
Greek vs Ukrainian Per Capita Income Correlation Chart
The statistical analysis conducted on geographies consisting of 482,808,471 people shows a moderate negative correlation between the proportion of Greeks and per capita income in the United States with a correlation coefficient (R) of -0.488 and weighted average of $49,309. Similarly, the statistical analysis conducted on geographies consisting of 448,721,179 people shows a poor negative correlation between the proportion of Ukrainians and per capita income in the United States with a correlation coefficient (R) of -0.186 and weighted average of $48,014, a difference of 2.7%.
Per Capita Income Correlation Summary
| Measurement | Greek | Ukrainian |
| Minimum | $11,668 | $11,586 |
| Maximum | $93,958 | $95,117 |
| Range | $82,290 | $83,531 |
| Mean | $44,253 | $42,023 |
| Median | $44,552 | $39,896 |
| Interquartile 25% (IQ1) | $28,035 | $32,403 |
| Interquartile 75% (IQ3) | $55,859 | $51,527 |
| Interquartile Range (IQR) | $27,823 | $19,124 |
| Standard Deviation (Sample) | $18,189 | $15,846 |
| Standard Deviation (Population) | $18,026 | $15,703 |
Demographics Similar to Greeks and Ukrainians by Per Capita Income
In terms of per capita income, the demographic groups most similar to Greeks are Immigrants from Eastern Europe ($49,316, a difference of 0.010%), Immigrants from Hungary ($49,303, a difference of 0.010%), Immigrants from North America ($49,302, a difference of 0.010%), Immigrants from Canada ($49,412, a difference of 0.21%), and Mongolian ($49,173, a difference of 0.28%). Similarly, the demographic groups most similar to Ukrainians are Immigrants from Southern Europe ($48,027, a difference of 0.030%), Austrian ($48,116, a difference of 0.21%), Immigrants from Ukraine ($48,134, a difference of 0.25%), Immigrants from Brazil ($48,164, a difference of 0.31%), and Immigrants from Indonesia ($48,195, a difference of 0.38%).
| Demographics | Rating | Rank | Per Capita Income |
| Immigrants | Canada | 99.8 /100 | #69 | Exceptional $49,412 |
| Immigrants | Eastern Europe | 99.8 /100 | #70 | Exceptional $49,316 |
| Greeks | 99.8 /100 | #71 | Exceptional $49,309 |
| Immigrants | Hungary | 99.8 /100 | #72 | Exceptional $49,303 |
| Immigrants | North America | 99.8 /100 | #73 | Exceptional $49,302 |
| Mongolians | 99.8 /100 | #74 | Exceptional $49,173 |
| Immigrants | Bolivia | 99.7 /100 | #75 | Exceptional $48,970 |
| Immigrants | England | 99.7 /100 | #76 | Exceptional $48,844 |
| Immigrants | Kazakhstan | 99.7 /100 | #77 | Exceptional $48,747 |
| Immigrants | Italy | 99.6 /100 | #78 | Exceptional $48,654 |
| Romanians | 99.5 /100 | #79 | Exceptional $48,445 |
| Egyptians | 99.5 /100 | #80 | Exceptional $48,358 |
| Armenians | 99.4 /100 | #81 | Exceptional $48,287 |
| Immigrants | Indonesia | 99.4 /100 | #82 | Exceptional $48,195 |
| Immigrants | Brazil | 99.4 /100 | #83 | Exceptional $48,164 |
| Immigrants | Ukraine | 99.3 /100 | #84 | Exceptional $48,134 |
| Austrians | 99.3 /100 | #85 | Exceptional $48,116 |
| Immigrants | Southern Europe | 99.3 /100 | #86 | Exceptional $48,027 |
| Ukrainians | 99.3 /100 | #87 | Exceptional $48,014 |
| Croatians | 99.0 /100 | #88 | Exceptional $47,742 |
| Northern Europeans | 98.9 /100 | #89 | Exceptional $47,698 |