Bhutanese vs Ugandan Median Earnings
COMPARE
Bhutanese
Ugandan
Median Earnings
Median Earnings Comparison
Bhutanese
Ugandans
$52,297
MEDIAN EARNINGS
100.0/ 100
METRIC RATING
46th/ 347
METRIC RANK
$47,854
MEDIAN EARNINGS
88.0/ 100
METRIC RATING
142nd/ 347
METRIC RANK
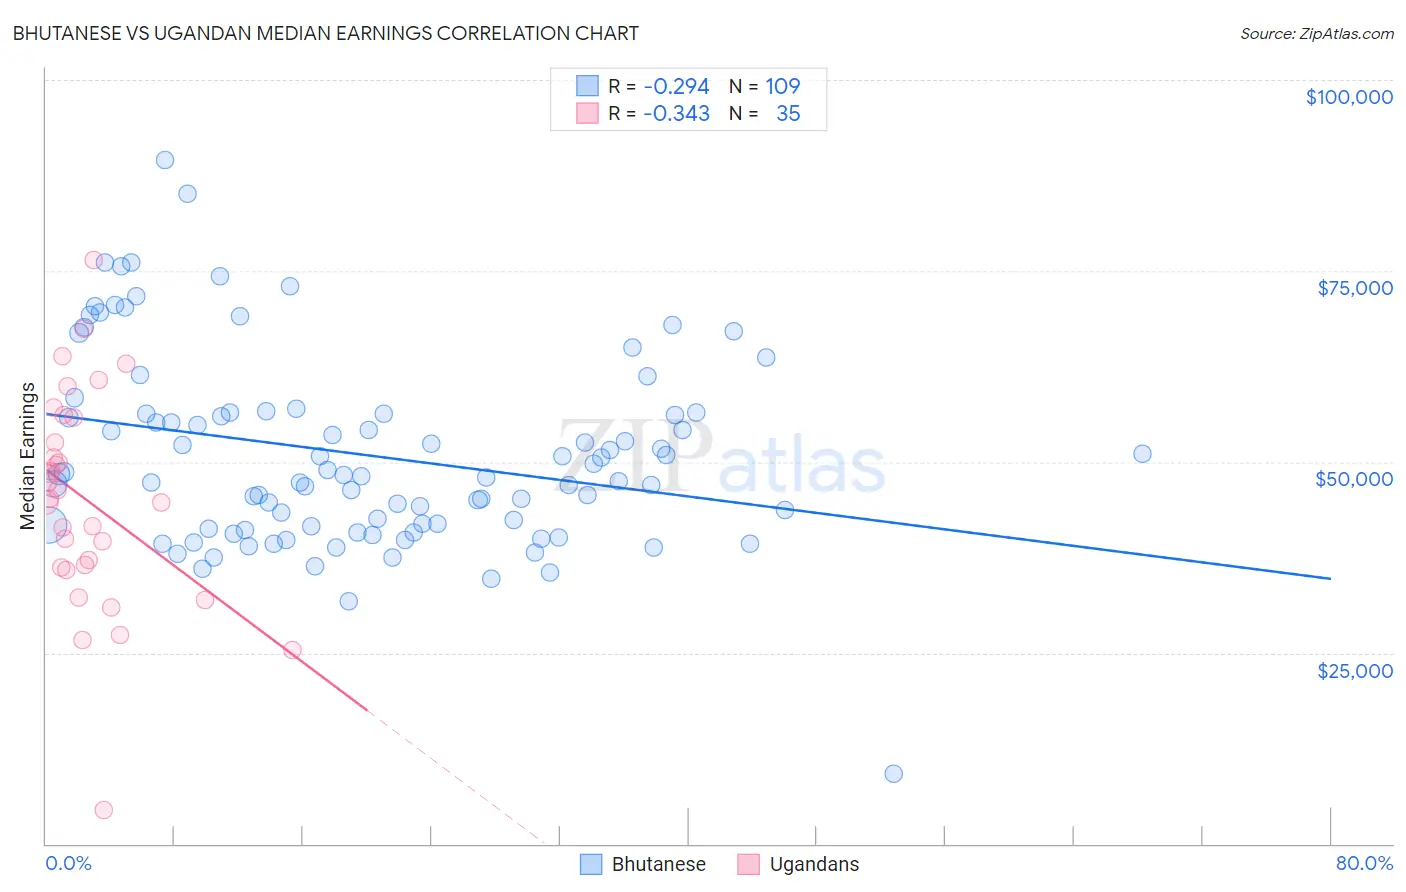
Bhutanese vs Ugandan Median Earnings Correlation Chart
The statistical analysis conducted on geographies consisting of 455,560,671 people shows a weak negative correlation between the proportion of Bhutanese and median earnings in the United States with a correlation coefficient (R) of -0.294 and weighted average of $52,297. Similarly, the statistical analysis conducted on geographies consisting of 94,012,409 people shows a mild negative correlation between the proportion of Ugandans and median earnings in the United States with a correlation coefficient (R) of -0.343 and weighted average of $47,854, a difference of 9.3%.
Median Earnings Correlation Summary
| Measurement | Bhutanese | Ugandan |
| Minimum | $9,211 | $4,426 |
| Maximum | $89,590 | $76,513 |
| Range | $80,379 | $72,087 |
| Mean | $50,906 | $45,002 |
| Median | $48,356 | $45,167 |
| Interquartile 25% (IQ1) | $41,435 | $36,215 |
| Interquartile 75% (IQ3) | $56,370 | $55,750 |
| Interquartile Range (IQR) | $14,935 | $19,535 |
| Standard Deviation (Sample) | $12,596 | $14,118 |
| Standard Deviation (Population) | $12,538 | $13,915 |
Similar Demographics by Median Earnings
Demographics Similar to Bhutanese by Median Earnings
In terms of median earnings, the demographic groups most similar to Bhutanese are Australian ($52,294, a difference of 0.010%), Immigrants from Czechoslovakia ($52,361, a difference of 0.12%), Immigrants from Europe ($52,195, a difference of 0.20%), Immigrants from Malaysia ($52,514, a difference of 0.41%), and Bulgarian ($52,512, a difference of 0.41%).
| Demographics | Rating | Rank | Median Earnings |
| Immigrants | Turkey | 100.0 /100 | #39 | Exceptional $52,960 |
| Israelis | 100.0 /100 | #40 | Exceptional $52,937 |
| Immigrants | Lithuania | 100.0 /100 | #41 | Exceptional $52,769 |
| Maltese | 100.0 /100 | #42 | Exceptional $52,526 |
| Immigrants | Malaysia | 100.0 /100 | #43 | Exceptional $52,514 |
| Bulgarians | 100.0 /100 | #44 | Exceptional $52,512 |
| Immigrants | Czechoslovakia | 100.0 /100 | #45 | Exceptional $52,361 |
| Bhutanese | 100.0 /100 | #46 | Exceptional $52,297 |
| Australians | 100.0 /100 | #47 | Exceptional $52,294 |
| Immigrants | Europe | 100.0 /100 | #48 | Exceptional $52,195 |
| Bolivians | 100.0 /100 | #49 | Exceptional $52,005 |
| Immigrants | South Africa | 100.0 /100 | #50 | Exceptional $51,850 |
| Immigrants | Austria | 99.9 /100 | #51 | Exceptional $51,826 |
| Estonians | 99.9 /100 | #52 | Exceptional $51,772 |
| Immigrants | Norway | 99.9 /100 | #53 | Exceptional $51,758 |
Demographics Similar to Ugandans by Median Earnings
In terms of median earnings, the demographic groups most similar to Ugandans are Swedish ($47,851, a difference of 0.010%), Immigrants from Sierra Leone ($47,875, a difference of 0.040%), Taiwanese ($47,902, a difference of 0.10%), Canadian ($47,911, a difference of 0.12%), and Hungarian ($47,795, a difference of 0.12%).
| Demographics | Rating | Rank | Median Earnings |
| Portuguese | 90.4 /100 | #135 | Exceptional $48,032 |
| Slovenes | 90.0 /100 | #136 | Excellent $47,995 |
| Immigrants | Nepal | 89.0 /100 | #137 | Excellent $47,925 |
| Europeans | 88.9 /100 | #138 | Excellent $47,915 |
| Canadians | 88.8 /100 | #139 | Excellent $47,911 |
| Taiwanese | 88.7 /100 | #140 | Excellent $47,902 |
| Immigrants | Sierra Leone | 88.3 /100 | #141 | Excellent $47,875 |
| Ugandans | 88.0 /100 | #142 | Excellent $47,854 |
| Swedes | 88.0 /100 | #143 | Excellent $47,851 |
| Hungarians | 87.1 /100 | #144 | Excellent $47,795 |
| Immigrants | Saudi Arabia | 85.6 /100 | #145 | Excellent $47,704 |
| Immigrants | Chile | 85.5 /100 | #146 | Excellent $47,697 |
| Immigrants | South Eastern Asia | 85.0 /100 | #147 | Excellent $47,671 |
| Immigrants | Eritrea | 84.8 /100 | #148 | Excellent $47,657 |
| Luxembourgers | 84.5 /100 | #149 | Excellent $47,640 |