Bhutanese vs Immigrants from Northern Europe Median Earnings
COMPARE
Bhutanese
Immigrants from Northern Europe
Median Earnings
Median Earnings Comparison
Bhutanese
Immigrants from Northern Europe
$52,297
MEDIAN EARNINGS
100.0/ 100
METRIC RATING
46th/ 347
METRIC RANK
$53,872
MEDIAN EARNINGS
100.0/ 100
METRIC RATING
26th/ 347
METRIC RANK
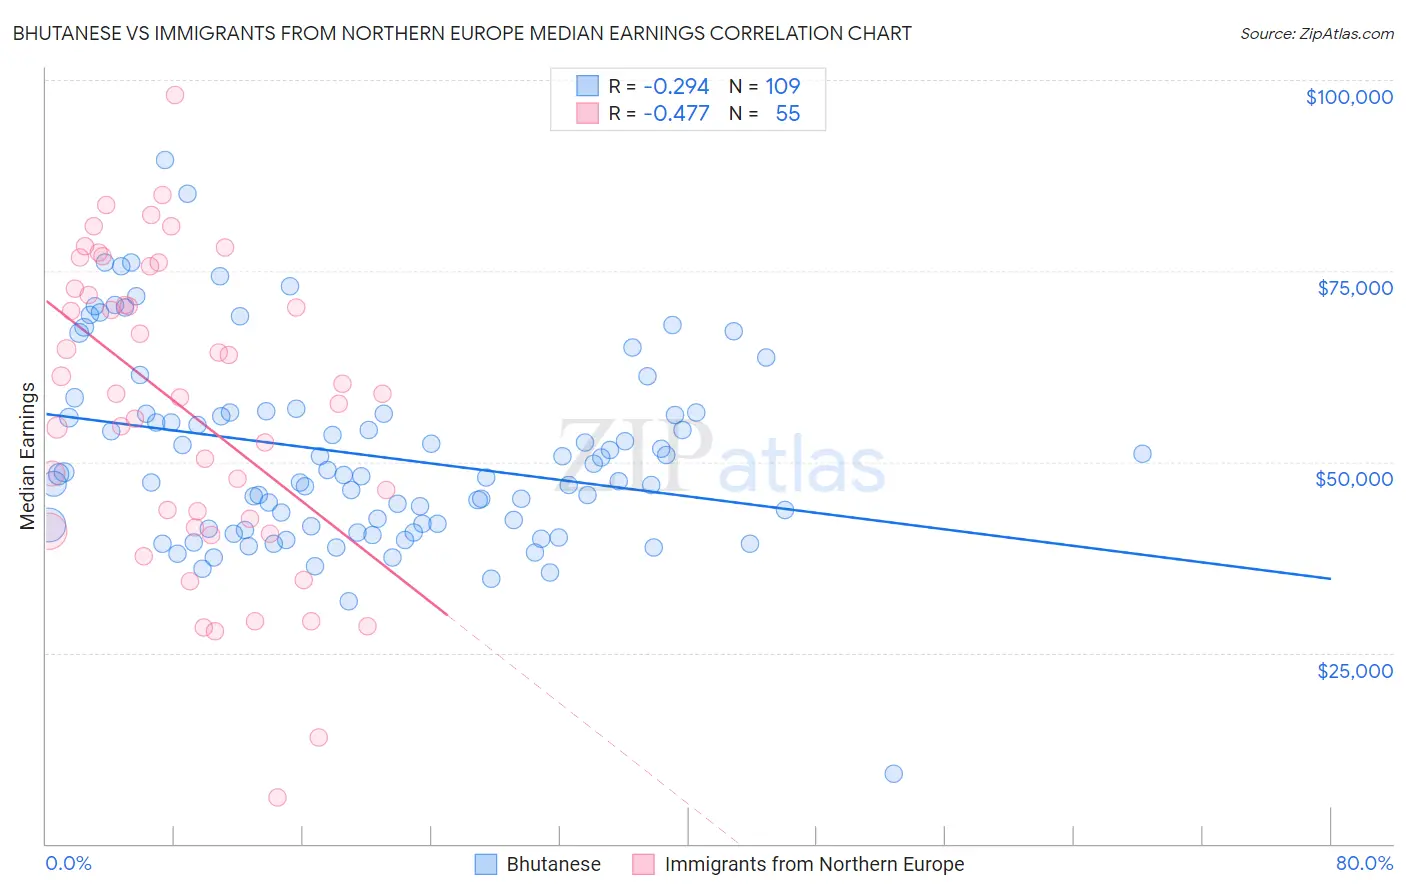
Bhutanese vs Immigrants from Northern Europe Median Earnings Correlation Chart
The statistical analysis conducted on geographies consisting of 455,560,671 people shows a weak negative correlation between the proportion of Bhutanese and median earnings in the United States with a correlation coefficient (R) of -0.294 and weighted average of $52,297. Similarly, the statistical analysis conducted on geographies consisting of 477,145,093 people shows a moderate negative correlation between the proportion of Immigrants from Northern Europe and median earnings in the United States with a correlation coefficient (R) of -0.477 and weighted average of $53,872, a difference of 3.0%.
Median Earnings Correlation Summary
| Measurement | Bhutanese | Immigrants from Northern Europe |
| Minimum | $9,211 | $5,997 |
| Maximum | $89,590 | $98,000 |
| Range | $80,379 | $92,003 |
| Mean | $50,906 | $56,961 |
| Median | $48,356 | $58,943 |
| Interquartile 25% (IQ1) | $41,435 | $41,349 |
| Interquartile 75% (IQ3) | $56,370 | $72,683 |
| Interquartile Range (IQR) | $14,935 | $31,335 |
| Standard Deviation (Sample) | $12,596 | $19,840 |
| Standard Deviation (Population) | $12,538 | $19,659 |
Demographics Similar to Bhutanese and Immigrants from Northern Europe by Median Earnings
In terms of median earnings, the demographic groups most similar to Bhutanese are Immigrants from Czechoslovakia ($52,361, a difference of 0.12%), Immigrants from Malaysia ($52,514, a difference of 0.41%), Bulgarian ($52,512, a difference of 0.41%), Maltese ($52,526, a difference of 0.44%), and Immigrants from Lithuania ($52,769, a difference of 0.90%). Similarly, the demographic groups most similar to Immigrants from Northern Europe are Asian ($53,690, a difference of 0.34%), Immigrants from France ($53,490, a difference of 0.71%), Immigrants from Russia ($53,457, a difference of 0.78%), Cambodian ($53,386, a difference of 0.91%), and Russian ($53,334, a difference of 1.0%).
| Demographics | Rating | Rank | Median Earnings |
| Immigrants | Northern Europe | 100.0 /100 | #26 | Exceptional $53,872 |
| Asians | 100.0 /100 | #27 | Exceptional $53,690 |
| Immigrants | France | 100.0 /100 | #28 | Exceptional $53,490 |
| Immigrants | Russia | 100.0 /100 | #29 | Exceptional $53,457 |
| Cambodians | 100.0 /100 | #30 | Exceptional $53,386 |
| Russians | 100.0 /100 | #31 | Exceptional $53,334 |
| Immigrants | Asia | 100.0 /100 | #32 | Exceptional $53,310 |
| Immigrants | Greece | 100.0 /100 | #33 | Exceptional $53,282 |
| Immigrants | Sri Lanka | 100.0 /100 | #34 | Exceptional $53,268 |
| Immigrants | Switzerland | 100.0 /100 | #35 | Exceptional $53,211 |
| Immigrants | Denmark | 100.0 /100 | #36 | Exceptional $53,186 |
| Immigrants | Belarus | 100.0 /100 | #37 | Exceptional $53,043 |
| Latvians | 100.0 /100 | #38 | Exceptional $53,001 |
| Immigrants | Turkey | 100.0 /100 | #39 | Exceptional $52,960 |
| Israelis | 100.0 /100 | #40 | Exceptional $52,937 |
| Immigrants | Lithuania | 100.0 /100 | #41 | Exceptional $52,769 |
| Maltese | 100.0 /100 | #42 | Exceptional $52,526 |
| Immigrants | Malaysia | 100.0 /100 | #43 | Exceptional $52,514 |
| Bulgarians | 100.0 /100 | #44 | Exceptional $52,512 |
| Immigrants | Czechoslovakia | 100.0 /100 | #45 | Exceptional $52,361 |
| Bhutanese | 100.0 /100 | #46 | Exceptional $52,297 |