Immigrants from Iran vs White/Caucasian Median Female Earnings
COMPARE
Immigrants from Iran
White/Caucasian
Median Female Earnings
Median Female Earnings Comparison
Immigrants from Iran
Whites/Caucasians
$47,154
MEDIAN FEMALE EARNINGS
100.0/ 100
METRIC RATING
9th/ 347
METRIC RANK
$37,531
MEDIAN FEMALE EARNINGS
1.1/ 100
METRIC RATING
254th/ 347
METRIC RANK
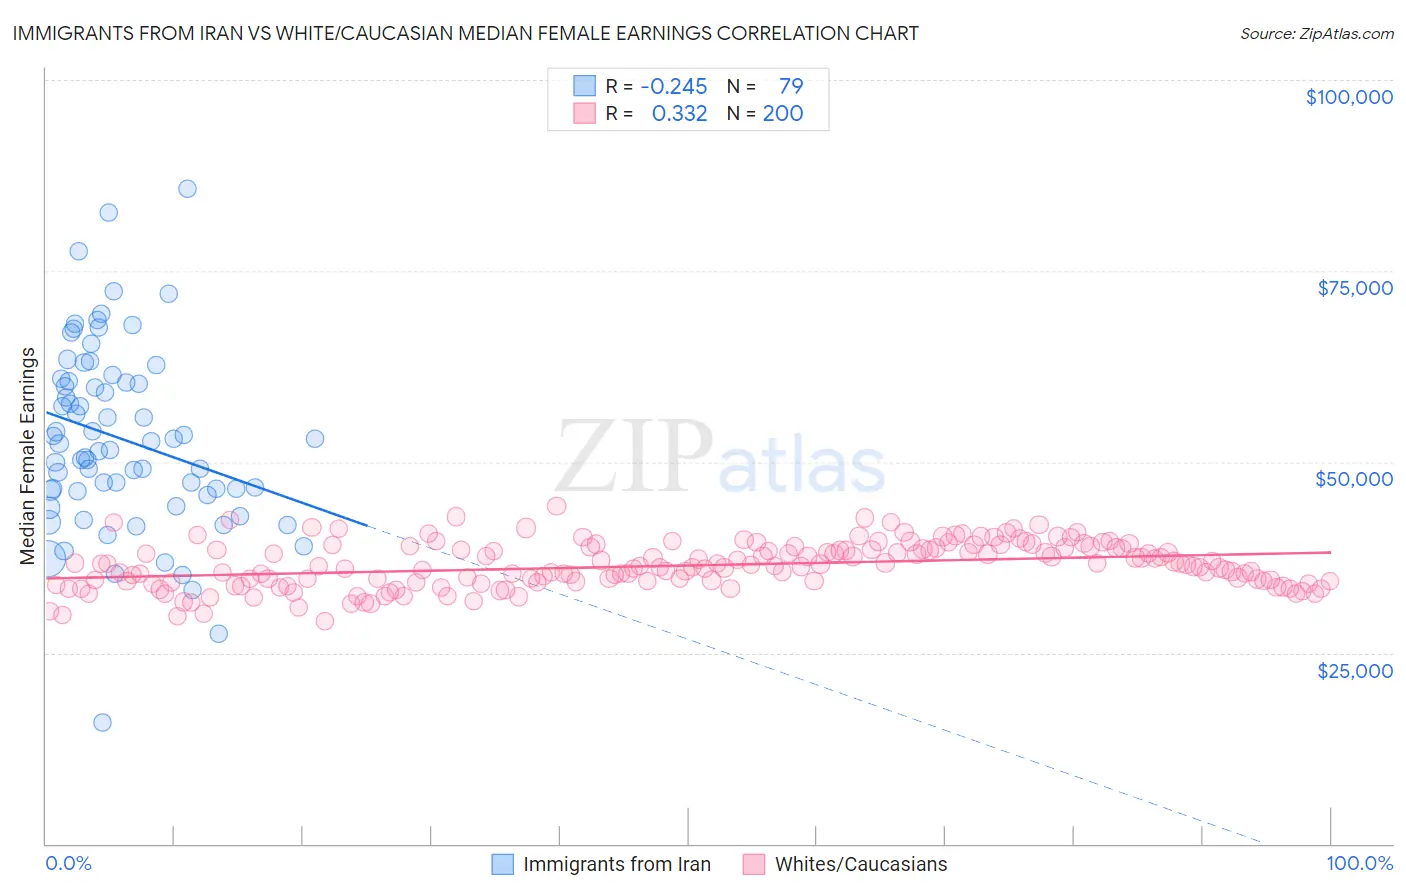
Immigrants from Iran vs White/Caucasian Median Female Earnings Correlation Chart
The statistical analysis conducted on geographies consisting of 279,791,483 people shows a weak negative correlation between the proportion of Immigrants from Iran and median female earnings in the United States with a correlation coefficient (R) of -0.245 and weighted average of $47,154. Similarly, the statistical analysis conducted on geographies consisting of 581,839,033 people shows a mild positive correlation between the proportion of Whites/Caucasians and median female earnings in the United States with a correlation coefficient (R) of 0.332 and weighted average of $37,531, a difference of 25.6%.
Median Female Earnings Correlation Summary
| Measurement | Immigrants from Iran | White/Caucasian |
| Minimum | $15,864 | $29,061 |
| Maximum | $85,822 | $44,249 |
| Range | $69,958 | $15,187 |
| Mean | $52,976 | $36,445 |
| Median | $52,367 | $36,298 |
| Interquartile 25% (IQ1) | $46,131 | $34,375 |
| Interquartile 75% (IQ3) | $60,507 | $38,681 |
| Interquartile Range (IQR) | $14,376 | $4,306 |
| Standard Deviation (Sample) | $12,151 | $2,956 |
| Standard Deviation (Population) | $12,074 | $2,949 |
Similar Demographics by Median Female Earnings
Demographics Similar to Immigrants from Iran by Median Female Earnings
In terms of median female earnings, the demographic groups most similar to Immigrants from Iran are Immigrants from China ($46,972, a difference of 0.39%), Okinawan ($46,905, a difference of 0.53%), Immigrants from Israel ($46,902, a difference of 0.54%), Iranian ($47,421, a difference of 0.57%), and Thai ($47,577, a difference of 0.90%).
| Demographics | Rating | Rank | Median Female Earnings |
| Filipinos | 100.0 /100 | #2 | Exceptional $49,508 |
| Immigrants | Taiwan | 100.0 /100 | #3 | Exceptional $49,256 |
| Immigrants | India | 100.0 /100 | #4 | Exceptional $48,292 |
| Immigrants | Singapore | 100.0 /100 | #5 | Exceptional $47,986 |
| Immigrants | Ireland | 100.0 /100 | #6 | Exceptional $47,598 |
| Thais | 100.0 /100 | #7 | Exceptional $47,577 |
| Iranians | 100.0 /100 | #8 | Exceptional $47,421 |
| Immigrants | Iran | 100.0 /100 | #9 | Exceptional $47,154 |
| Immigrants | China | 100.0 /100 | #10 | Exceptional $46,972 |
| Okinawans | 100.0 /100 | #11 | Exceptional $46,905 |
| Immigrants | Israel | 100.0 /100 | #12 | Exceptional $46,902 |
| Immigrants | Australia | 100.0 /100 | #13 | Exceptional $46,573 |
| Soviet Union | 100.0 /100 | #14 | Exceptional $46,556 |
| Immigrants | Eastern Asia | 100.0 /100 | #15 | Exceptional $46,502 |
| Indians (Asian) | 100.0 /100 | #16 | Exceptional $46,481 |
Demographics Similar to Whites/Caucasians by Median Female Earnings
In terms of median female earnings, the demographic groups most similar to Whites/Caucasians are Colville ($37,514, a difference of 0.040%), Samoan ($37,498, a difference of 0.090%), Hawaiian ($37,497, a difference of 0.090%), Belizean ($37,429, a difference of 0.27%), and Scotch-Irish ($37,383, a difference of 0.39%).
| Demographics | Rating | Rank | Median Female Earnings |
| Immigrants | Somalia | 2.4 /100 | #247 | Tragic $37,914 |
| Alaskan Athabascans | 2.3 /100 | #248 | Tragic $37,905 |
| Swiss | 2.3 /100 | #249 | Tragic $37,904 |
| Immigrants | Iraq | 2.2 /100 | #250 | Tragic $37,864 |
| Welsh | 2.1 /100 | #251 | Tragic $37,856 |
| Immigrants | Dominica | 2.0 /100 | #252 | Tragic $37,825 |
| Danes | 1.6 /100 | #253 | Tragic $37,730 |
| Whites/Caucasians | 1.1 /100 | #254 | Tragic $37,531 |
| Colville | 1.1 /100 | #255 | Tragic $37,514 |
| Samoans | 1.0 /100 | #256 | Tragic $37,498 |
| Hawaiians | 1.0 /100 | #257 | Tragic $37,497 |
| Belizeans | 0.9 /100 | #258 | Tragic $37,429 |
| Scotch-Irish | 0.8 /100 | #259 | Tragic $37,383 |
| Dutch | 0.7 /100 | #260 | Tragic $37,339 |
| Malaysians | 0.7 /100 | #261 | Tragic $37,298 |