Thai vs White/Caucasian Median Female Earnings
COMPARE
Thai
White/Caucasian
Median Female Earnings
Median Female Earnings Comparison
Thais
Whites/Caucasians
$47,577
MEDIAN FEMALE EARNINGS
100.0/ 100
METRIC RATING
7th/ 347
METRIC RANK
$37,531
MEDIAN FEMALE EARNINGS
1.1/ 100
METRIC RATING
254th/ 347
METRIC RANK
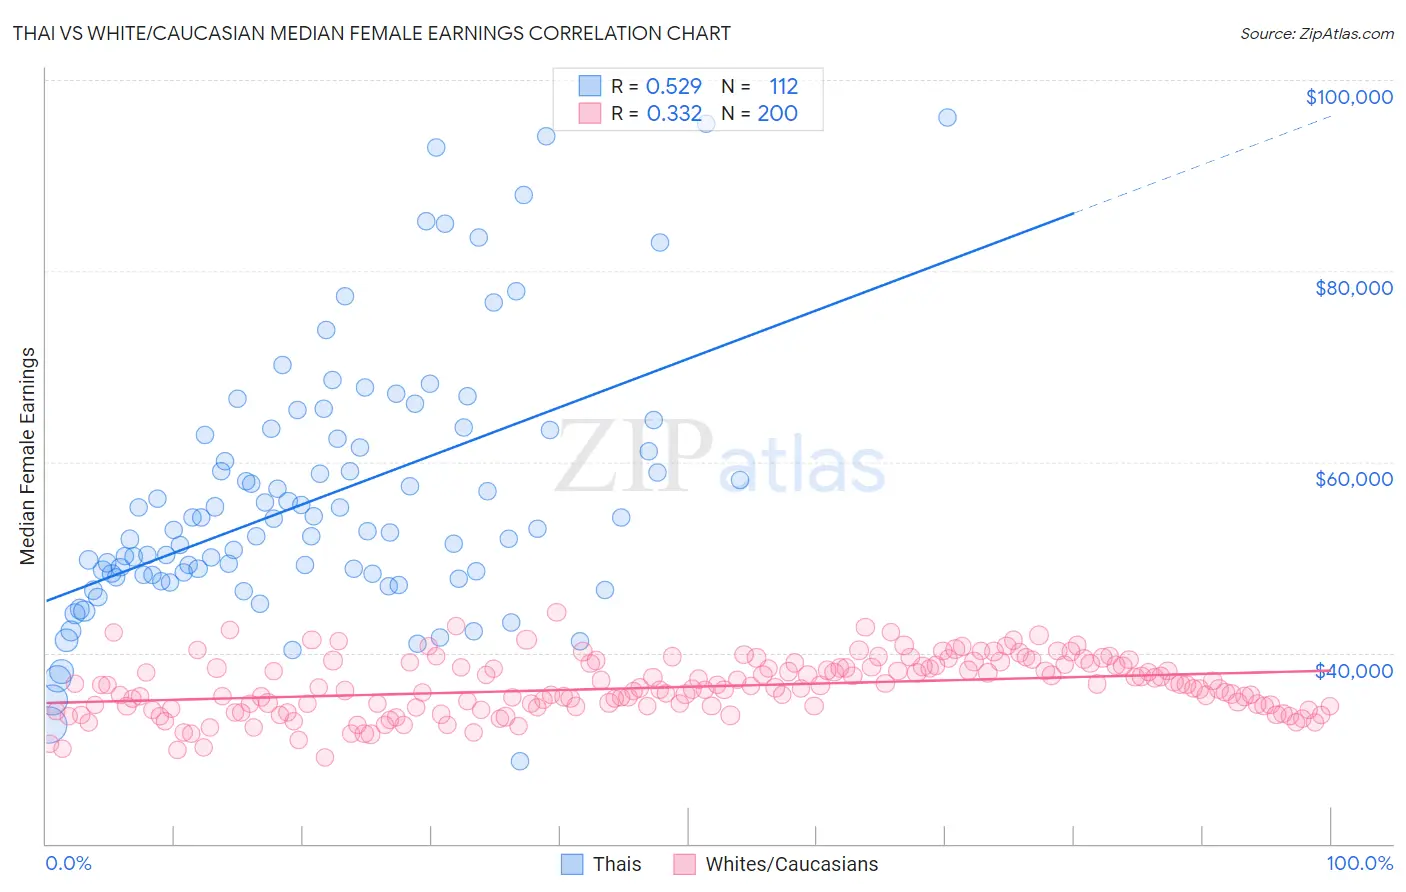
Thai vs White/Caucasian Median Female Earnings Correlation Chart
The statistical analysis conducted on geographies consisting of 475,636,214 people shows a substantial positive correlation between the proportion of Thais and median female earnings in the United States with a correlation coefficient (R) of 0.529 and weighted average of $47,577. Similarly, the statistical analysis conducted on geographies consisting of 581,839,033 people shows a mild positive correlation between the proportion of Whites/Caucasians and median female earnings in the United States with a correlation coefficient (R) of 0.332 and weighted average of $37,531, a difference of 26.8%.
Median Female Earnings Correlation Summary
| Measurement | Thai | White/Caucasian |
| Minimum | $28,625 | $29,061 |
| Maximum | $96,063 | $44,249 |
| Range | $67,438 | $15,187 |
| Mean | $56,190 | $36,445 |
| Median | $52,820 | $36,298 |
| Interquartile 25% (IQ1) | $48,126 | $34,375 |
| Interquartile 75% (IQ3) | $62,651 | $38,681 |
| Interquartile Range (IQR) | $14,524 | $4,306 |
| Standard Deviation (Sample) | $13,471 | $2,956 |
| Standard Deviation (Population) | $13,411 | $2,949 |
Similar Demographics by Median Female Earnings
Demographics Similar to Thais by Median Female Earnings
In terms of median female earnings, the demographic groups most similar to Thais are Immigrants from Ireland ($47,598, a difference of 0.040%), Iranian ($47,421, a difference of 0.33%), Immigrants from Singapore ($47,986, a difference of 0.86%), Immigrants from Iran ($47,154, a difference of 0.90%), and Immigrants from China ($46,972, a difference of 1.3%).
| Demographics | Rating | Rank | Median Female Earnings |
| Immigrants | Hong Kong | 100.0 /100 | #1 | Exceptional $49,818 |
| Filipinos | 100.0 /100 | #2 | Exceptional $49,508 |
| Immigrants | Taiwan | 100.0 /100 | #3 | Exceptional $49,256 |
| Immigrants | India | 100.0 /100 | #4 | Exceptional $48,292 |
| Immigrants | Singapore | 100.0 /100 | #5 | Exceptional $47,986 |
| Immigrants | Ireland | 100.0 /100 | #6 | Exceptional $47,598 |
| Thais | 100.0 /100 | #7 | Exceptional $47,577 |
| Iranians | 100.0 /100 | #8 | Exceptional $47,421 |
| Immigrants | Iran | 100.0 /100 | #9 | Exceptional $47,154 |
| Immigrants | China | 100.0 /100 | #10 | Exceptional $46,972 |
| Okinawans | 100.0 /100 | #11 | Exceptional $46,905 |
| Immigrants | Israel | 100.0 /100 | #12 | Exceptional $46,902 |
| Immigrants | Australia | 100.0 /100 | #13 | Exceptional $46,573 |
| Soviet Union | 100.0 /100 | #14 | Exceptional $46,556 |
| Immigrants | Eastern Asia | 100.0 /100 | #15 | Exceptional $46,502 |
Demographics Similar to Whites/Caucasians by Median Female Earnings
In terms of median female earnings, the demographic groups most similar to Whites/Caucasians are Colville ($37,514, a difference of 0.040%), Samoan ($37,498, a difference of 0.090%), Hawaiian ($37,497, a difference of 0.090%), Belizean ($37,429, a difference of 0.27%), and Scotch-Irish ($37,383, a difference of 0.39%).
| Demographics | Rating | Rank | Median Female Earnings |
| Immigrants | Somalia | 2.4 /100 | #247 | Tragic $37,914 |
| Alaskan Athabascans | 2.3 /100 | #248 | Tragic $37,905 |
| Swiss | 2.3 /100 | #249 | Tragic $37,904 |
| Immigrants | Iraq | 2.2 /100 | #250 | Tragic $37,864 |
| Welsh | 2.1 /100 | #251 | Tragic $37,856 |
| Immigrants | Dominica | 2.0 /100 | #252 | Tragic $37,825 |
| Danes | 1.6 /100 | #253 | Tragic $37,730 |
| Whites/Caucasians | 1.1 /100 | #254 | Tragic $37,531 |
| Colville | 1.1 /100 | #255 | Tragic $37,514 |
| Samoans | 1.0 /100 | #256 | Tragic $37,498 |
| Hawaiians | 1.0 /100 | #257 | Tragic $37,497 |
| Belizeans | 0.9 /100 | #258 | Tragic $37,429 |
| Scotch-Irish | 0.8 /100 | #259 | Tragic $37,383 |
| Dutch | 0.7 /100 | #260 | Tragic $37,339 |
| Malaysians | 0.7 /100 | #261 | Tragic $37,298 |