Belizean vs Immigrants from Eastern Africa Householder Income Ages 45 - 64 years
COMPARE
Belizean
Immigrants from Eastern Africa
Householder Income Ages 45 - 64 years
Householder Income Ages 45 - 64 years Comparison
Belizeans
Immigrants from Eastern Africa
$88,684
HOUSEHOLDER INCOME AGES 45 - 64 YEARS
0.3/ 100
METRIC RATING
261st/ 347
METRIC RANK
$98,467
HOUSEHOLDER INCOME AGES 45 - 64 YEARS
28.3/ 100
METRIC RATING
196th/ 347
METRIC RANK
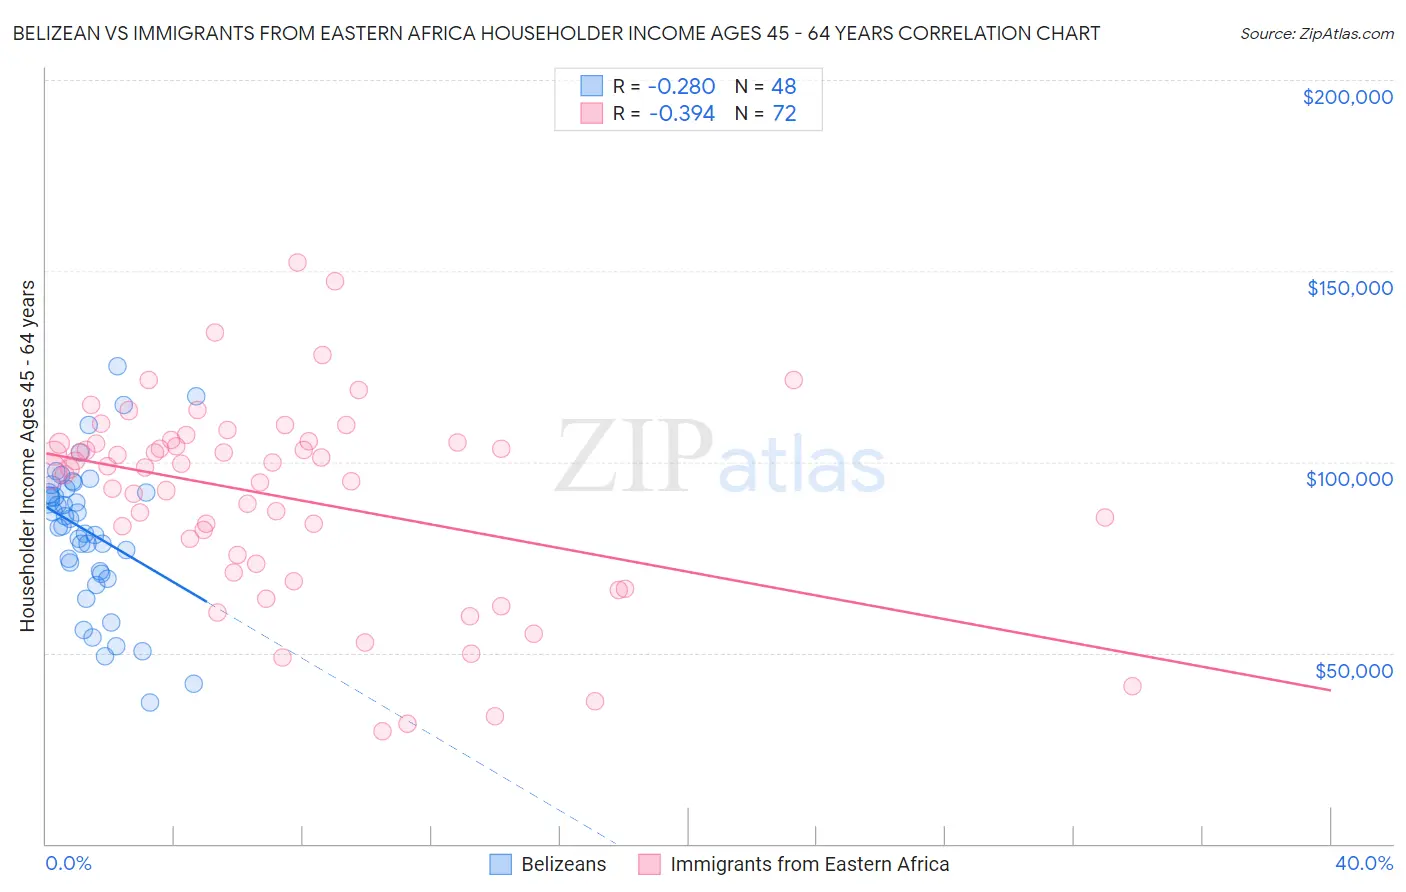
Belizean vs Immigrants from Eastern Africa Householder Income Ages 45 - 64 years Correlation Chart
The statistical analysis conducted on geographies consisting of 144,082,540 people shows a weak negative correlation between the proportion of Belizeans and household income with householder between the ages 45 and 64 in the United States with a correlation coefficient (R) of -0.280 and weighted average of $88,684. Similarly, the statistical analysis conducted on geographies consisting of 354,576,754 people shows a mild negative correlation between the proportion of Immigrants from Eastern Africa and household income with householder between the ages 45 and 64 in the United States with a correlation coefficient (R) of -0.394 and weighted average of $98,467, a difference of 11.0%.
Householder Income Ages 45 - 64 years Correlation Summary
| Measurement | Belizean | Immigrants from Eastern Africa |
| Minimum | $37,000 | $29,590 |
| Maximum | $124,977 | $152,098 |
| Range | $87,977 | $122,508 |
| Mean | $81,502 | $90,687 |
| Median | $84,116 | $98,438 |
| Interquartile 25% (IQ1) | $70,959 | $74,490 |
| Interquartile 75% (IQ3) | $92,338 | $104,938 |
| Interquartile Range (IQR) | $21,379 | $30,447 |
| Standard Deviation (Sample) | $18,999 | $25,936 |
| Standard Deviation (Population) | $18,800 | $25,755 |
Similar Demographics by Householder Income Ages 45 - 64 years
Demographics Similar to Belizeans by Householder Income Ages 45 - 64 years
In terms of householder income ages 45 - 64 years, the demographic groups most similar to Belizeans are Somali ($88,600, a difference of 0.090%), Liberian ($88,929, a difference of 0.28%), Immigrants from Senegal ($88,421, a difference of 0.30%), Osage ($88,390, a difference of 0.33%), and Jamaican ($88,327, a difference of 0.40%).
| Demographics | Rating | Rank | Householder Income Ages 45 - 64 years |
| Immigrants | Guyana | 0.6 /100 | #254 | Tragic $90,186 |
| West Indians | 0.5 /100 | #255 | Tragic $89,906 |
| French American Indians | 0.5 /100 | #256 | Tragic $89,811 |
| German Russians | 0.4 /100 | #257 | Tragic $89,398 |
| Immigrants | Barbados | 0.4 /100 | #258 | Tragic $89,394 |
| Immigrants | Nicaragua | 0.4 /100 | #259 | Tragic $89,108 |
| Liberians | 0.3 /100 | #260 | Tragic $88,929 |
| Belizeans | 0.3 /100 | #261 | Tragic $88,684 |
| Somalis | 0.3 /100 | #262 | Tragic $88,600 |
| Immigrants | Senegal | 0.3 /100 | #263 | Tragic $88,421 |
| Osage | 0.3 /100 | #264 | Tragic $88,390 |
| Jamaicans | 0.2 /100 | #265 | Tragic $88,327 |
| Immigrants | West Indies | 0.2 /100 | #266 | Tragic $88,164 |
| Hmong | 0.2 /100 | #267 | Tragic $88,115 |
| Immigrants | Micronesia | 0.2 /100 | #268 | Tragic $87,864 |
Demographics Similar to Immigrants from Eastern Africa by Householder Income Ages 45 - 64 years
In terms of householder income ages 45 - 64 years, the demographic groups most similar to Immigrants from Eastern Africa are Spanish ($98,554, a difference of 0.090%), Puget Sound Salish ($98,340, a difference of 0.13%), Uruguayan ($98,660, a difference of 0.20%), Immigrants from Iraq ($98,201, a difference of 0.27%), and Hawaiian ($98,778, a difference of 0.32%).
| Demographics | Rating | Rank | Householder Income Ages 45 - 64 years |
| Immigrants | South America | 35.4 /100 | #189 | Fair $99,126 |
| French Canadians | 35.1 /100 | #190 | Fair $99,093 |
| Kenyans | 33.7 /100 | #191 | Fair $98,970 |
| Celtics | 32.9 /100 | #192 | Fair $98,896 |
| Hawaiians | 31.6 /100 | #193 | Fair $98,778 |
| Uruguayans | 30.3 /100 | #194 | Fair $98,660 |
| Spanish | 29.2 /100 | #195 | Fair $98,554 |
| Immigrants | Eastern Africa | 28.3 /100 | #196 | Fair $98,467 |
| Puget Sound Salish | 27.0 /100 | #197 | Fair $98,340 |
| Immigrants | Iraq | 25.7 /100 | #198 | Fair $98,201 |
| Whites/Caucasians | 24.6 /100 | #199 | Fair $98,091 |
| Immigrants | Kenya | 23.5 /100 | #200 | Fair $97,964 |
| Yugoslavians | 20.0 /100 | #201 | Fair $97,558 |
| Tlingit-Haida | 18.9 /100 | #202 | Poor $97,417 |
| Immigrants | Thailand | 18.8 /100 | #203 | Poor $97,400 |