Belizean vs Immigrants from Trinidad and Tobago In Labor Force | Age 35-44
COMPARE
Belizean
Immigrants from Trinidad and Tobago
In Labor Force | Age 35-44
In Labor Force | Age 35-44 Comparison
Belizeans
Immigrants from Trinidad and Tobago
83.1%
IN LABOR FORCE | AGE 35-44
0.0/ 100
METRIC RATING
278th/ 347
METRIC RANK
84.4%
IN LABOR FORCE | AGE 35-44
50.7/ 100
METRIC RATING
173rd/ 347
METRIC RANK
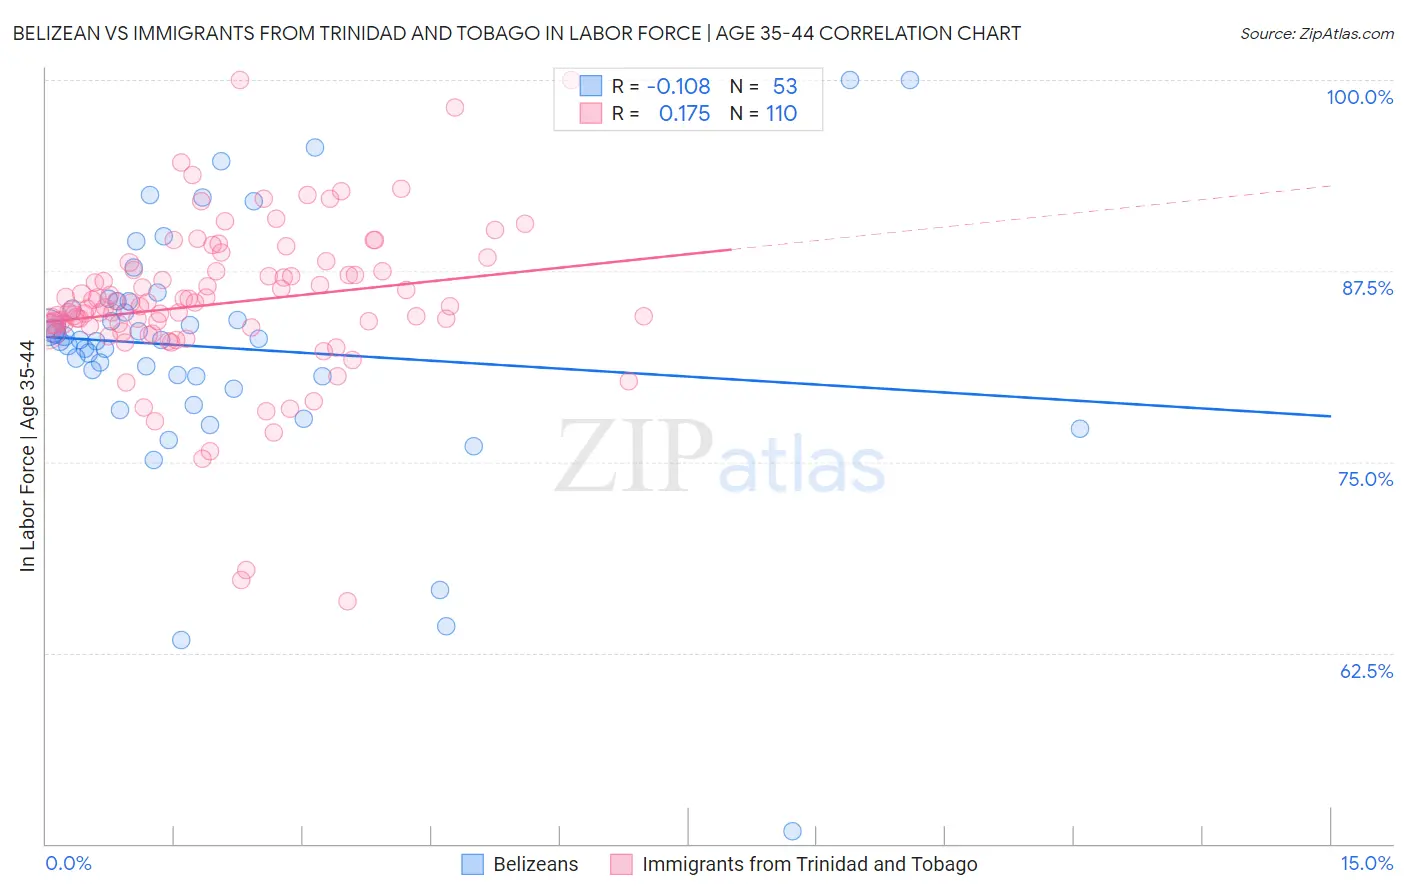
Belizean vs Immigrants from Trinidad and Tobago In Labor Force | Age 35-44 Correlation Chart
The statistical analysis conducted on geographies consisting of 144,190,758 people shows a poor negative correlation between the proportion of Belizeans and labor force participation rate among population between the ages 35 and 44 in the United States with a correlation coefficient (R) of -0.108 and weighted average of 83.1%. Similarly, the statistical analysis conducted on geographies consisting of 223,496,330 people shows a poor positive correlation between the proportion of Immigrants from Trinidad and Tobago and labor force participation rate among population between the ages 35 and 44 in the United States with a correlation coefficient (R) of 0.175 and weighted average of 84.4%, a difference of 1.5%.
In Labor Force | Age 35-44 Correlation Summary
| Measurement | Belizean | Immigrants from Trinidad and Tobago |
| Minimum | 50.8% | 65.9% |
| Maximum | 100.0% | 100.0% |
| Range | 49.2% | 34.1% |
| Mean | 82.5% | 85.4% |
| Median | 83.0% | 85.2% |
| Interquartile 25% (IQ1) | 80.2% | 83.8% |
| Interquartile 75% (IQ3) | 85.5% | 87.5% |
| Interquartile Range (IQR) | 5.4% | 3.7% |
| Standard Deviation (Sample) | 8.4% | 5.3% |
| Standard Deviation (Population) | 8.3% | 5.3% |
Similar Demographics by In Labor Force | Age 35-44
Demographics Similar to Belizeans by In Labor Force | Age 35-44
In terms of in labor force | age 35-44, the demographic groups most similar to Belizeans are Immigrants from Micronesia (83.1%, a difference of 0.010%), Dominican (83.1%, a difference of 0.050%), Samoan (83.2%, a difference of 0.070%), Delaware (83.2%, a difference of 0.080%), and Hawaiian (83.2%, a difference of 0.090%).
| Demographics | Rating | Rank | In Labor Force | Age 35-44 |
| French American Indians | 0.0 /100 | #271 | Tragic 83.2% |
| Immigrants | Fiji | 0.0 /100 | #272 | Tragic 83.2% |
| Spanish | 0.0 /100 | #273 | Tragic 83.2% |
| Immigrants | Nonimmigrants | 0.0 /100 | #274 | Tragic 83.2% |
| Hawaiians | 0.0 /100 | #275 | Tragic 83.2% |
| Delaware | 0.0 /100 | #276 | Tragic 83.2% |
| Samoans | 0.0 /100 | #277 | Tragic 83.2% |
| Belizeans | 0.0 /100 | #278 | Tragic 83.1% |
| Immigrants | Micronesia | 0.0 /100 | #279 | Tragic 83.1% |
| Dominicans | 0.0 /100 | #280 | Tragic 83.1% |
| Guatemalans | 0.0 /100 | #281 | Tragic 83.0% |
| Osage | 0.0 /100 | #282 | Tragic 82.9% |
| Immigrants | Guatemala | 0.0 /100 | #283 | Tragic 82.9% |
| Immigrants | Dominican Republic | 0.0 /100 | #284 | Tragic 82.9% |
| Fijians | 0.0 /100 | #285 | Tragic 82.9% |
Demographics Similar to Immigrants from Trinidad and Tobago by In Labor Force | Age 35-44
In terms of in labor force | age 35-44, the demographic groups most similar to Immigrants from Trinidad and Tobago are Scandinavian (84.4%, a difference of 0.0%), Immigrants from Iran (84.4%, a difference of 0.0%), Immigrants from Afghanistan (84.4%, a difference of 0.010%), Immigrants from Jordan (84.4%, a difference of 0.010%), and Jordanian (84.4%, a difference of 0.010%).
| Demographics | Rating | Rank | In Labor Force | Age 35-44 |
| Alsatians | 55.2 /100 | #166 | Average 84.4% |
| Immigrants | Portugal | 55.2 /100 | #167 | Average 84.4% |
| Irish | 53.1 /100 | #168 | Average 84.4% |
| Immigrants | Afghanistan | 52.7 /100 | #169 | Average 84.4% |
| Immigrants | Jordan | 52.5 /100 | #170 | Average 84.4% |
| Jordanians | 51.7 /100 | #171 | Average 84.4% |
| Scandinavians | 51.2 /100 | #172 | Average 84.4% |
| Immigrants | Trinidad and Tobago | 50.7 /100 | #173 | Average 84.4% |
| Immigrants | Iran | 50.0 /100 | #174 | Average 84.4% |
| Pakistanis | 48.2 /100 | #175 | Average 84.4% |
| Sri Lankans | 47.3 /100 | #176 | Average 84.4% |
| French Canadians | 44.3 /100 | #177 | Average 84.3% |
| Northern Europeans | 44.1 /100 | #178 | Average 84.3% |
| Immigrants | South Africa | 42.8 /100 | #179 | Average 84.3% |
| Danes | 38.8 /100 | #180 | Fair 84.3% |