Belizean vs Immigrants from Trinidad and Tobago 7th Grade
COMPARE
Belizean
Immigrants from Trinidad and Tobago
7th Grade
7th Grade Comparison
Belizeans
Immigrants from Trinidad and Tobago
93.5%
7TH GRADE
0.0/ 100
METRIC RATING
321st/ 347
METRIC RANK
95.1%
7TH GRADE
0.1/ 100
METRIC RATING
278th/ 347
METRIC RANK
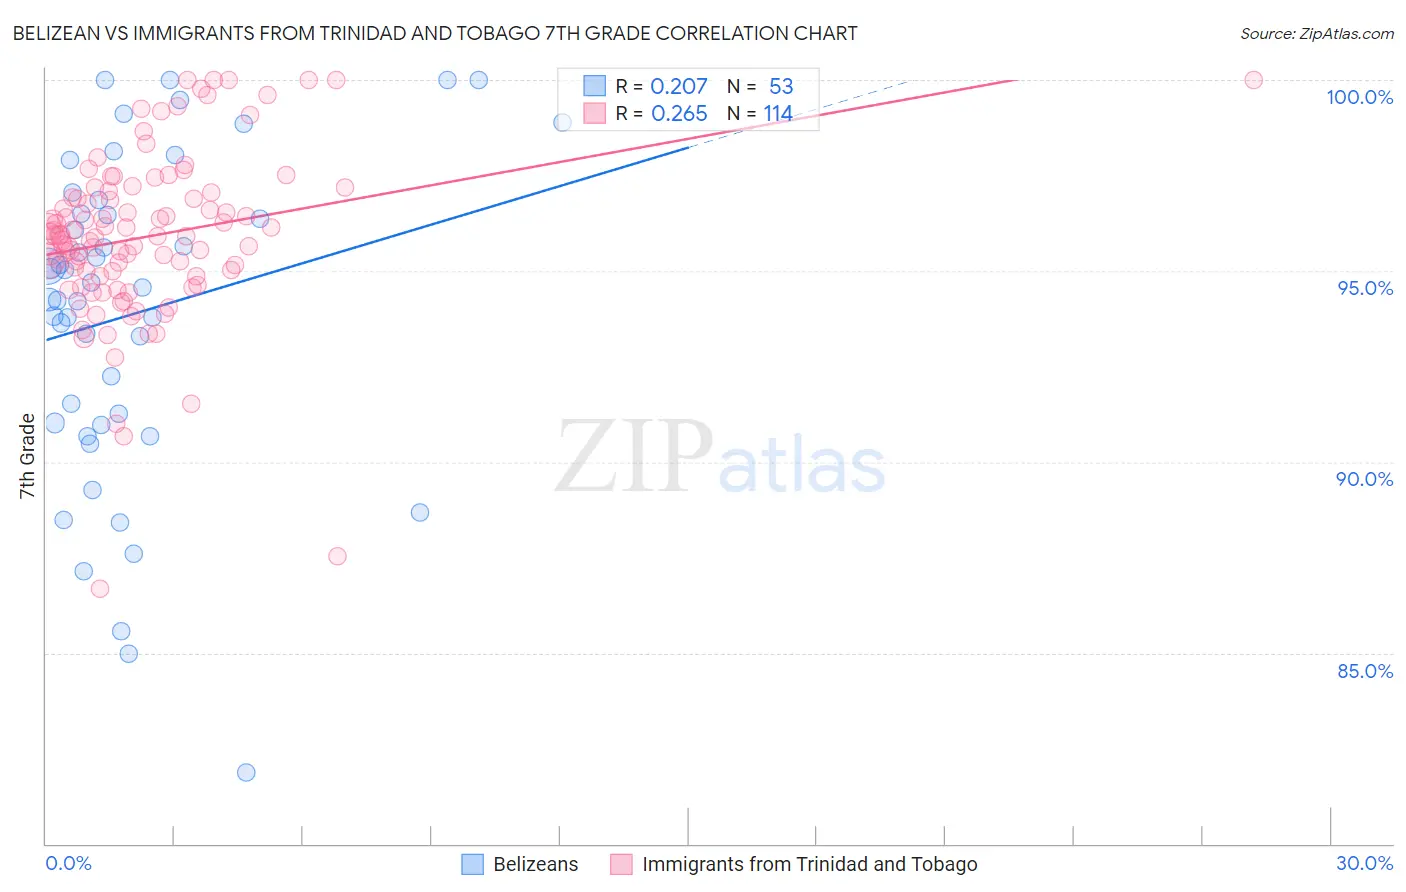
Belizean vs Immigrants from Trinidad and Tobago 7th Grade Correlation Chart
The statistical analysis conducted on geographies consisting of 144,138,333 people shows a weak positive correlation between the proportion of Belizeans and percentage of population with at least 7th grade education in the United States with a correlation coefficient (R) of 0.207 and weighted average of 93.5%. Similarly, the statistical analysis conducted on geographies consisting of 223,526,834 people shows a weak positive correlation between the proportion of Immigrants from Trinidad and Tobago and percentage of population with at least 7th grade education in the United States with a correlation coefficient (R) of 0.265 and weighted average of 95.1%, a difference of 1.7%.
7th Grade Correlation Summary
| Measurement | Belizean | Immigrants from Trinidad and Tobago |
| Minimum | 81.9% | 86.7% |
| Maximum | 100.0% | 100.0% |
| Range | 18.1% | 13.3% |
| Mean | 93.9% | 95.9% |
| Median | 94.6% | 95.9% |
| Interquartile 25% (IQ1) | 91.0% | 94.9% |
| Interquartile 75% (IQ3) | 96.7% | 97.1% |
| Interquartile Range (IQR) | 5.7% | 2.2% |
| Standard Deviation (Sample) | 4.2% | 2.2% |
| Standard Deviation (Population) | 4.2% | 2.2% |
Similar Demographics by 7th Grade
Demographics Similar to Belizeans by 7th Grade
In terms of 7th grade, the demographic groups most similar to Belizeans are Immigrants from Fiji (93.5%, a difference of 0.040%), Nicaraguan (93.5%, a difference of 0.040%), Immigrants from Belize (93.4%, a difference of 0.15%), Dominican (93.3%, a difference of 0.16%), and Immigrants from Cambodia (93.7%, a difference of 0.21%).
| Demographics | Rating | Rank | 7th Grade |
| Japanese | 0.0 /100 | #314 | Tragic 94.0% |
| Vietnamese | 0.0 /100 | #315 | Tragic 93.9% |
| Immigrants | Vietnam | 0.0 /100 | #316 | Tragic 93.9% |
| Immigrants | Cuba | 0.0 /100 | #317 | Tragic 93.8% |
| Immigrants | Ecuador | 0.0 /100 | #318 | Tragic 93.7% |
| Immigrants | Cambodia | 0.0 /100 | #319 | Tragic 93.7% |
| Immigrants | Fiji | 0.0 /100 | #320 | Tragic 93.5% |
| Belizeans | 0.0 /100 | #321 | Tragic 93.5% |
| Nicaraguans | 0.0 /100 | #322 | Tragic 93.5% |
| Immigrants | Belize | 0.0 /100 | #323 | Tragic 93.4% |
| Dominicans | 0.0 /100 | #324 | Tragic 93.3% |
| Central American Indians | 0.0 /100 | #325 | Tragic 93.3% |
| Nepalese | 0.0 /100 | #326 | Tragic 93.2% |
| Immigrants | Cabo Verde | 0.0 /100 | #327 | Tragic 93.1% |
| Immigrants | Nicaragua | 0.0 /100 | #328 | Tragic 93.0% |
Demographics Similar to Immigrants from Trinidad and Tobago by 7th Grade
In terms of 7th grade, the demographic groups most similar to Immigrants from Trinidad and Tobago are Barbadian (95.1%, a difference of 0.010%), Immigrants from Afghanistan (95.1%, a difference of 0.030%), Immigrants from St. Vincent and the Grenadines (95.0%, a difference of 0.030%), Tohono O'odham (95.0%, a difference of 0.040%), and Immigrants from Thailand (95.1%, a difference of 0.050%).
| Demographics | Rating | Rank | 7th Grade |
| Immigrants | South America | 0.2 /100 | #271 | Tragic 95.1% |
| Peruvians | 0.2 /100 | #272 | Tragic 95.1% |
| Immigrants | Uzbekistan | 0.2 /100 | #273 | Tragic 95.1% |
| Immigrants | Western Africa | 0.2 /100 | #274 | Tragic 95.1% |
| Immigrants | Colombia | 0.2 /100 | #275 | Tragic 95.1% |
| Immigrants | Thailand | 0.2 /100 | #276 | Tragic 95.1% |
| Immigrants | Afghanistan | 0.2 /100 | #277 | Tragic 95.1% |
| Immigrants | Trinidad and Tobago | 0.1 /100 | #278 | Tragic 95.1% |
| Barbadians | 0.1 /100 | #279 | Tragic 95.1% |
| Immigrants | St. Vincent and the Grenadines | 0.1 /100 | #280 | Tragic 95.0% |
| Tohono O'odham | 0.1 /100 | #281 | Tragic 95.0% |
| Immigrants | Bolivia | 0.1 /100 | #282 | Tragic 95.0% |
| Immigrants | Barbados | 0.1 /100 | #283 | Tragic 95.0% |
| Armenians | 0.1 /100 | #284 | Tragic 95.0% |
| Immigrants | Eritrea | 0.1 /100 | #285 | Tragic 94.9% |