Belizean vs Immigrants from China Householder Income Ages 45 - 64 years
COMPARE
Belizean
Immigrants from China
Householder Income Ages 45 - 64 years
Householder Income Ages 45 - 64 years Comparison
Belizeans
Immigrants from China
$88,684
HOUSEHOLDER INCOME AGES 45 - 64 YEARS
0.3/ 100
METRIC RATING
261st/ 347
METRIC RANK
$122,178
HOUSEHOLDER INCOME AGES 45 - 64 YEARS
100.0/ 100
METRIC RATING
16th/ 347
METRIC RANK
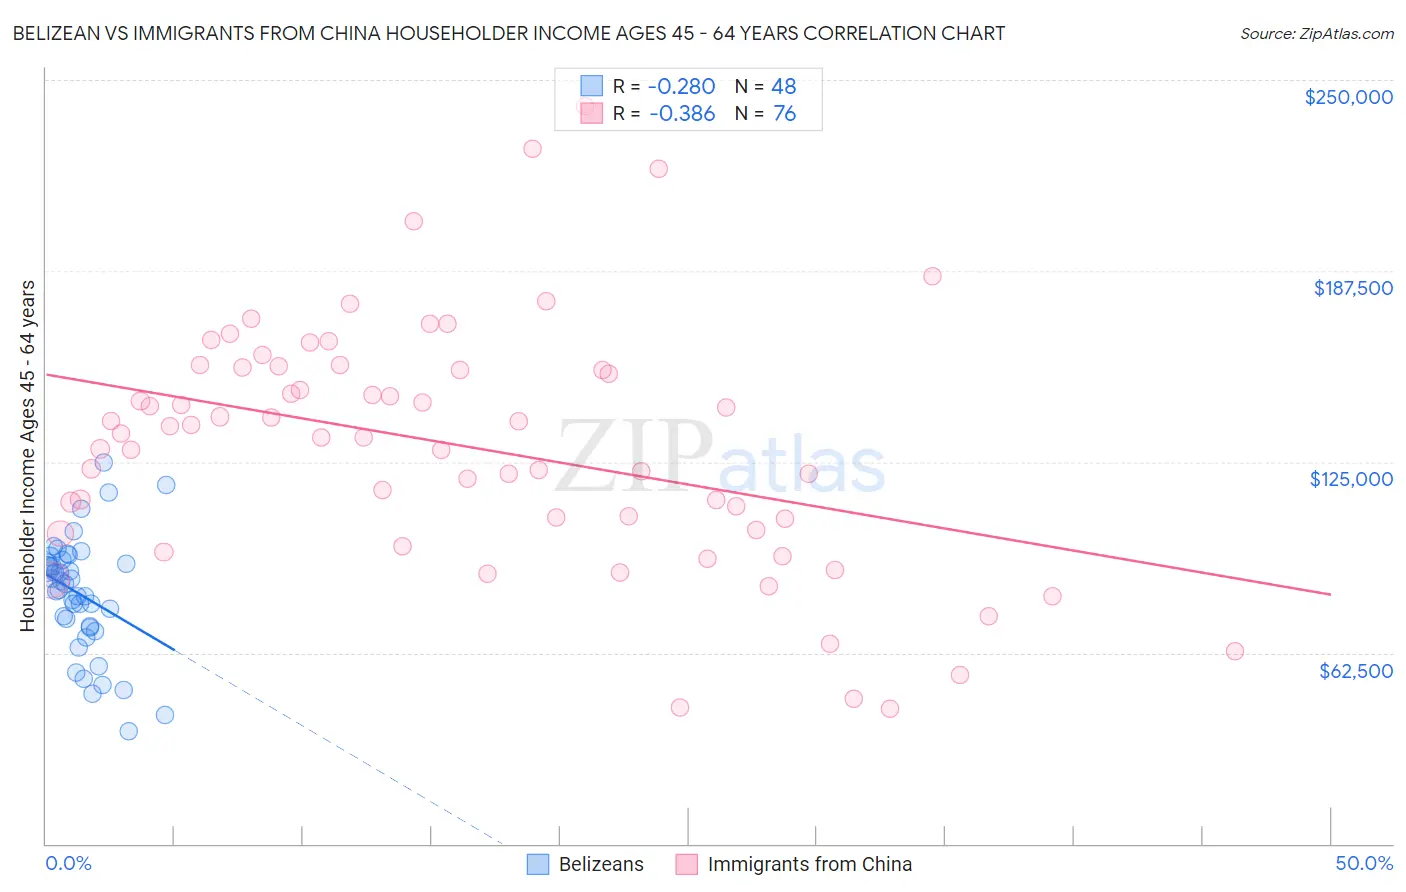
Belizean vs Immigrants from China Householder Income Ages 45 - 64 years Correlation Chart
The statistical analysis conducted on geographies consisting of 144,082,540 people shows a weak negative correlation between the proportion of Belizeans and household income with householder between the ages 45 and 64 in the United States with a correlation coefficient (R) of -0.280 and weighted average of $88,684. Similarly, the statistical analysis conducted on geographies consisting of 455,924,954 people shows a mild negative correlation between the proportion of Immigrants from China and household income with householder between the ages 45 and 64 in the United States with a correlation coefficient (R) of -0.386 and weighted average of $122,178, a difference of 37.8%.
Householder Income Ages 45 - 64 years Correlation Summary
| Measurement | Belizean | Immigrants from China |
| Minimum | $37,000 | $44,167 |
| Maximum | $124,977 | $241,602 |
| Range | $87,977 | $197,435 |
| Mean | $81,502 | $130,137 |
| Median | $84,116 | $133,566 |
| Interquartile 25% (IQ1) | $70,959 | $104,536 |
| Interquartile 75% (IQ3) | $92,338 | $155,654 |
| Interquartile Range (IQR) | $21,379 | $51,118 |
| Standard Deviation (Sample) | $18,999 | $40,272 |
| Standard Deviation (Population) | $18,800 | $40,006 |
Similar Demographics by Householder Income Ages 45 - 64 years
Demographics Similar to Belizeans by Householder Income Ages 45 - 64 years
In terms of householder income ages 45 - 64 years, the demographic groups most similar to Belizeans are Somali ($88,600, a difference of 0.090%), Liberian ($88,929, a difference of 0.28%), Immigrants from Senegal ($88,421, a difference of 0.30%), Osage ($88,390, a difference of 0.33%), and Jamaican ($88,327, a difference of 0.40%).
| Demographics | Rating | Rank | Householder Income Ages 45 - 64 years |
| Immigrants | Guyana | 0.6 /100 | #254 | Tragic $90,186 |
| West Indians | 0.5 /100 | #255 | Tragic $89,906 |
| French American Indians | 0.5 /100 | #256 | Tragic $89,811 |
| German Russians | 0.4 /100 | #257 | Tragic $89,398 |
| Immigrants | Barbados | 0.4 /100 | #258 | Tragic $89,394 |
| Immigrants | Nicaragua | 0.4 /100 | #259 | Tragic $89,108 |
| Liberians | 0.3 /100 | #260 | Tragic $88,929 |
| Belizeans | 0.3 /100 | #261 | Tragic $88,684 |
| Somalis | 0.3 /100 | #262 | Tragic $88,600 |
| Immigrants | Senegal | 0.3 /100 | #263 | Tragic $88,421 |
| Osage | 0.3 /100 | #264 | Tragic $88,390 |
| Jamaicans | 0.2 /100 | #265 | Tragic $88,327 |
| Immigrants | West Indies | 0.2 /100 | #266 | Tragic $88,164 |
| Hmong | 0.2 /100 | #267 | Tragic $88,115 |
| Immigrants | Micronesia | 0.2 /100 | #268 | Tragic $87,864 |
Demographics Similar to Immigrants from China by Householder Income Ages 45 - 64 years
In terms of householder income ages 45 - 64 years, the demographic groups most similar to Immigrants from China are Immigrants from Eastern Asia ($122,222, a difference of 0.040%), Indian (Asian) ($122,343, a difference of 0.14%), Immigrants from Ireland ($122,757, a difference of 0.47%), Immigrants from Israel ($122,893, a difference of 0.59%), and Burmese ($121,444, a difference of 0.60%).
| Demographics | Rating | Rank | Householder Income Ages 45 - 64 years |
| Okinawans | 100.0 /100 | #9 | Exceptional $124,796 |
| Immigrants | South Central Asia | 100.0 /100 | #10 | Exceptional $124,188 |
| Cypriots | 100.0 /100 | #11 | Exceptional $123,396 |
| Immigrants | Israel | 100.0 /100 | #12 | Exceptional $122,893 |
| Immigrants | Ireland | 100.0 /100 | #13 | Exceptional $122,757 |
| Indians (Asian) | 100.0 /100 | #14 | Exceptional $122,343 |
| Immigrants | Eastern Asia | 100.0 /100 | #15 | Exceptional $122,222 |
| Immigrants | China | 100.0 /100 | #16 | Exceptional $122,178 |
| Burmese | 100.0 /100 | #17 | Exceptional $121,444 |
| Immigrants | Korea | 100.0 /100 | #18 | Exceptional $121,243 |
| Eastern Europeans | 100.0 /100 | #19 | Exceptional $120,684 |
| Immigrants | Australia | 100.0 /100 | #20 | Exceptional $119,308 |
| Immigrants | Sri Lanka | 100.0 /100 | #21 | Exceptional $119,094 |
| Immigrants | Belgium | 100.0 /100 | #22 | Exceptional $118,932 |
| Bolivians | 100.0 /100 | #23 | Exceptional $118,871 |