Immigrants from Cambodia vs Immigrants from Romania Per Capita Income
COMPARE
Immigrants from Cambodia
Immigrants from Romania
Per Capita Income
Per Capita Income Comparison
Immigrants from Cambodia
Immigrants from Romania
$40,434
PER CAPITA INCOME
2.6/ 100
METRIC RATING
237th/ 347
METRIC RANK
$49,463
PER CAPITA INCOME
99.9/ 100
METRIC RATING
67th/ 347
METRIC RANK
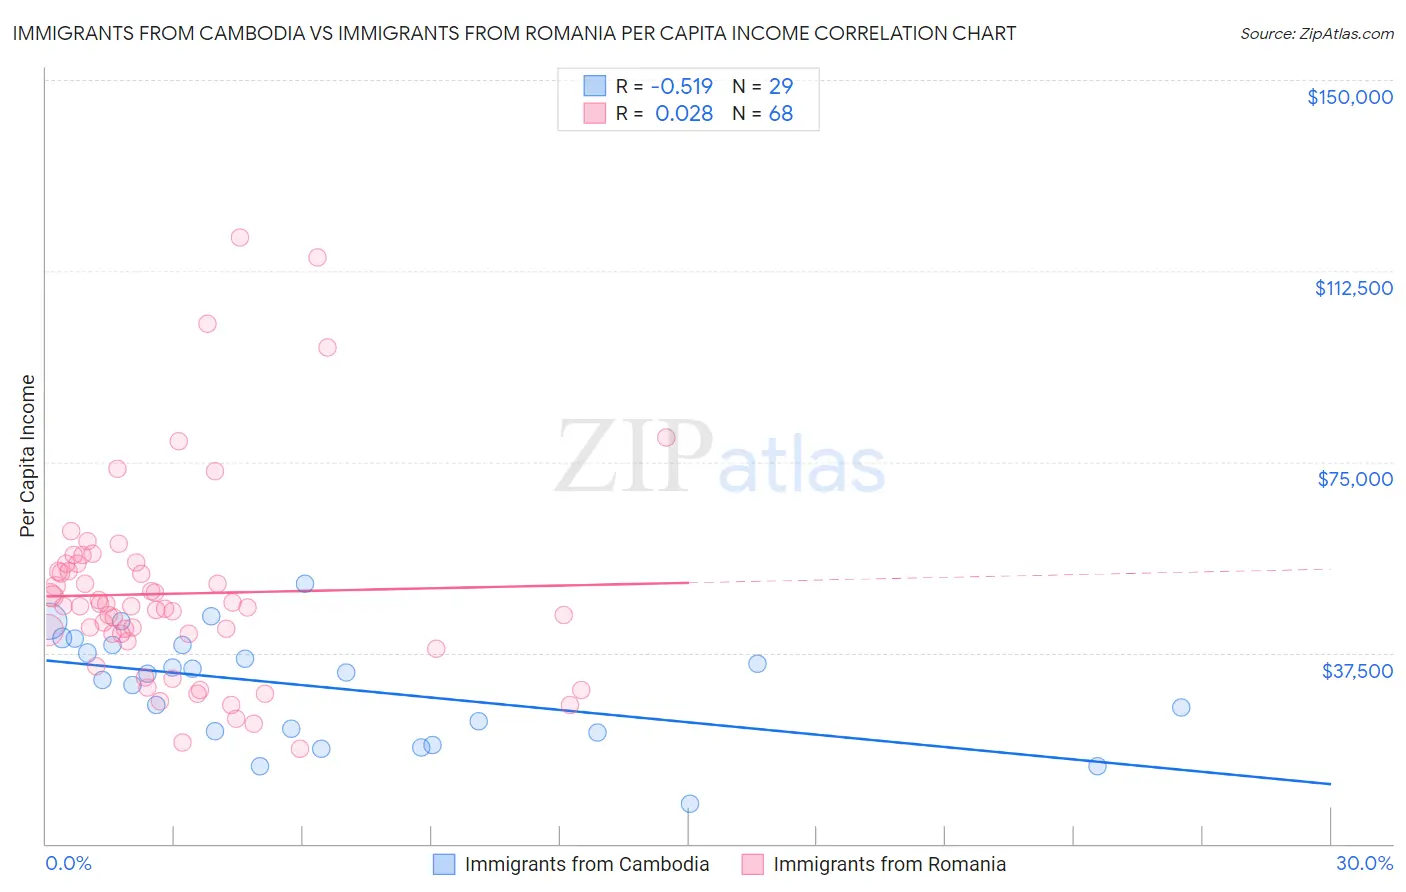
Immigrants from Cambodia vs Immigrants from Romania Per Capita Income Correlation Chart
The statistical analysis conducted on geographies consisting of 205,159,034 people shows a substantial negative correlation between the proportion of Immigrants from Cambodia and per capita income in the United States with a correlation coefficient (R) of -0.519 and weighted average of $40,434. Similarly, the statistical analysis conducted on geographies consisting of 256,972,544 people shows no correlation between the proportion of Immigrants from Romania and per capita income in the United States with a correlation coefficient (R) of 0.028 and weighted average of $49,463, a difference of 22.3%.
Per Capita Income Correlation Summary
| Measurement | Immigrants from Cambodia | Immigrants from Romania |
| Minimum | $7,849 | $18,731 |
| Maximum | $51,157 | $119,092 |
| Range | $43,308 | $100,361 |
| Mean | $30,701 | $49,122 |
| Median | $33,314 | $46,712 |
| Interquartile 25% (IQ1) | $21,996 | $40,435 |
| Interquartile 75% (IQ3) | $39,085 | $54,228 |
| Interquartile Range (IQR) | $17,089 | $13,794 |
| Standard Deviation (Sample) | $10,577 | $19,681 |
| Standard Deviation (Population) | $10,393 | $19,535 |
Similar Demographics by Per Capita Income
Demographics Similar to Immigrants from Cambodia by Per Capita Income
In terms of per capita income, the demographic groups most similar to Immigrants from Cambodia are Somali ($40,367, a difference of 0.16%), Tsimshian ($40,344, a difference of 0.22%), Immigrants from Nigeria ($40,339, a difference of 0.24%), British West Indian ($40,330, a difference of 0.26%), and Immigrants from Western Africa ($40,294, a difference of 0.35%).
| Demographics | Rating | Rank | Per Capita Income |
| Native Hawaiians | 4.9 /100 | #230 | Tragic $41,017 |
| Senegalese | 4.8 /100 | #231 | Tragic $41,000 |
| Guyanese | 4.5 /100 | #232 | Tragic $40,949 |
| Delaware | 3.8 /100 | #233 | Tragic $40,778 |
| Immigrants | West Indies | 3.7 /100 | #234 | Tragic $40,763 |
| Immigrants | Guyana | 3.6 /100 | #235 | Tragic $40,742 |
| Immigrants | Nonimmigrants | 3.4 /100 | #236 | Tragic $40,669 |
| Immigrants | Cambodia | 2.6 /100 | #237 | Tragic $40,434 |
| Somalis | 2.4 /100 | #238 | Tragic $40,367 |
| Tsimshian | 2.4 /100 | #239 | Tragic $40,344 |
| Immigrants | Nigeria | 2.3 /100 | #240 | Tragic $40,339 |
| British West Indians | 2.3 /100 | #241 | Tragic $40,330 |
| Immigrants | Western Africa | 2.2 /100 | #242 | Tragic $40,294 |
| German Russians | 2.2 /100 | #243 | Tragic $40,266 |
| French American Indians | 2.1 /100 | #244 | Tragic $40,244 |
Demographics Similar to Immigrants from Romania by Per Capita Income
In terms of per capita income, the demographic groups most similar to Immigrants from Romania are Lithuanian ($49,448, a difference of 0.030%), Immigrants from Bulgaria ($49,482, a difference of 0.040%), Immigrants from Canada ($49,412, a difference of 0.10%), Bolivian ($49,526, a difference of 0.13%), and Immigrants from Eastern Europe ($49,316, a difference of 0.30%).
| Demographics | Rating | Rank | Per Capita Income |
| Immigrants | Scotland | 99.9 /100 | #60 | Exceptional $49,893 |
| Argentineans | 99.9 /100 | #61 | Exceptional $49,862 |
| Immigrants | Asia | 99.9 /100 | #62 | Exceptional $49,741 |
| Maltese | 99.9 /100 | #63 | Exceptional $49,640 |
| Immigrants | Argentina | 99.9 /100 | #64 | Exceptional $49,627 |
| Bolivians | 99.9 /100 | #65 | Exceptional $49,526 |
| Immigrants | Bulgaria | 99.9 /100 | #66 | Exceptional $49,482 |
| Immigrants | Romania | 99.9 /100 | #67 | Exceptional $49,463 |
| Lithuanians | 99.8 /100 | #68 | Exceptional $49,448 |
| Immigrants | Canada | 99.8 /100 | #69 | Exceptional $49,412 |
| Immigrants | Eastern Europe | 99.8 /100 | #70 | Exceptional $49,316 |
| Greeks | 99.8 /100 | #71 | Exceptional $49,309 |
| Immigrants | Hungary | 99.8 /100 | #72 | Exceptional $49,303 |
| Immigrants | North America | 99.8 /100 | #73 | Exceptional $49,302 |
| Mongolians | 99.8 /100 | #74 | Exceptional $49,173 |