Yuman vs Immigrants from Romania Per Capita Income
COMPARE
Yuman
Immigrants from Romania
Per Capita Income
Per Capita Income Comparison
Yuman
Immigrants from Romania
$33,236
PER CAPITA INCOME
0.0/ 100
METRIC RATING
335th/ 347
METRIC RANK
$49,463
PER CAPITA INCOME
99.9/ 100
METRIC RATING
67th/ 347
METRIC RANK
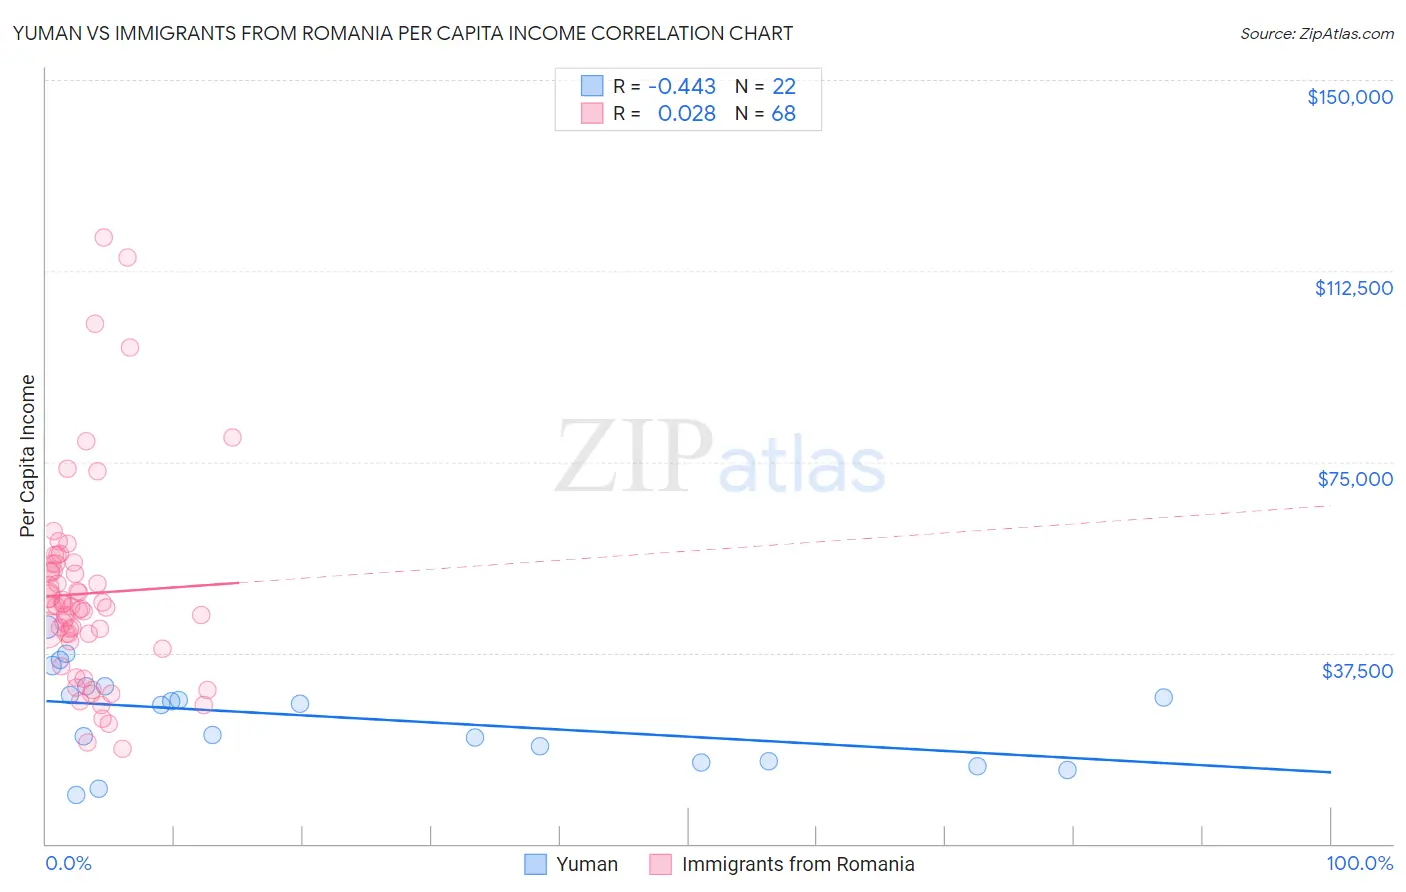
Yuman vs Immigrants from Romania Per Capita Income Correlation Chart
The statistical analysis conducted on geographies consisting of 40,696,310 people shows a moderate negative correlation between the proportion of Yuman and per capita income in the United States with a correlation coefficient (R) of -0.443 and weighted average of $33,236. Similarly, the statistical analysis conducted on geographies consisting of 256,972,544 people shows no correlation between the proportion of Immigrants from Romania and per capita income in the United States with a correlation coefficient (R) of 0.028 and weighted average of $49,463, a difference of 48.8%.
Per Capita Income Correlation Summary
| Measurement | Yuman | Immigrants from Romania |
| Minimum | $9,533 | $18,731 |
| Maximum | $42,569 | $119,092 |
| Range | $33,036 | $100,361 |
| Mean | $24,831 | $49,122 |
| Median | $27,284 | $46,712 |
| Interquartile 25% (IQ1) | $16,137 | $40,435 |
| Interquartile 75% (IQ3) | $30,879 | $54,228 |
| Interquartile Range (IQR) | $14,742 | $13,794 |
| Standard Deviation (Sample) | $8,979 | $19,681 |
| Standard Deviation (Population) | $8,772 | $19,535 |
Similar Demographics by Per Capita Income
Demographics Similar to Yuman by Per Capita Income
In terms of per capita income, the demographic groups most similar to Yuman are Native/Alaskan ($33,279, a difference of 0.13%), Yakama ($33,009, a difference of 0.69%), Houma ($32,996, a difference of 0.73%), Immigrants from Yemen ($33,696, a difference of 1.4%), and Sioux ($33,921, a difference of 2.1%).
| Demographics | Rating | Rank | Per Capita Income |
| Menominee | 0.0 /100 | #328 | Tragic $34,578 |
| Mexicans | 0.0 /100 | #329 | Tragic $34,559 |
| Spanish American Indians | 0.0 /100 | #330 | Tragic $34,195 |
| Immigrants | Mexico | 0.0 /100 | #331 | Tragic $33,931 |
| Sioux | 0.0 /100 | #332 | Tragic $33,921 |
| Immigrants | Yemen | 0.0 /100 | #333 | Tragic $33,696 |
| Natives/Alaskans | 0.0 /100 | #334 | Tragic $33,279 |
| Yuman | 0.0 /100 | #335 | Tragic $33,236 |
| Yakama | 0.0 /100 | #336 | Tragic $33,009 |
| Houma | 0.0 /100 | #337 | Tragic $32,996 |
| Arapaho | 0.0 /100 | #338 | Tragic $32,345 |
| Pueblo | 0.0 /100 | #339 | Tragic $32,012 |
| Crow | 0.0 /100 | #340 | Tragic $31,729 |
| Puerto Ricans | 0.0 /100 | #341 | Tragic $31,268 |
| Hopi | 0.0 /100 | #342 | Tragic $31,177 |
Demographics Similar to Immigrants from Romania by Per Capita Income
In terms of per capita income, the demographic groups most similar to Immigrants from Romania are Lithuanian ($49,448, a difference of 0.030%), Immigrants from Bulgaria ($49,482, a difference of 0.040%), Immigrants from Canada ($49,412, a difference of 0.10%), Bolivian ($49,526, a difference of 0.13%), and Immigrants from Eastern Europe ($49,316, a difference of 0.30%).
| Demographics | Rating | Rank | Per Capita Income |
| Immigrants | Scotland | 99.9 /100 | #60 | Exceptional $49,893 |
| Argentineans | 99.9 /100 | #61 | Exceptional $49,862 |
| Immigrants | Asia | 99.9 /100 | #62 | Exceptional $49,741 |
| Maltese | 99.9 /100 | #63 | Exceptional $49,640 |
| Immigrants | Argentina | 99.9 /100 | #64 | Exceptional $49,627 |
| Bolivians | 99.9 /100 | #65 | Exceptional $49,526 |
| Immigrants | Bulgaria | 99.9 /100 | #66 | Exceptional $49,482 |
| Immigrants | Romania | 99.9 /100 | #67 | Exceptional $49,463 |
| Lithuanians | 99.8 /100 | #68 | Exceptional $49,448 |
| Immigrants | Canada | 99.8 /100 | #69 | Exceptional $49,412 |
| Immigrants | Eastern Europe | 99.8 /100 | #70 | Exceptional $49,316 |
| Greeks | 99.8 /100 | #71 | Exceptional $49,309 |
| Immigrants | Hungary | 99.8 /100 | #72 | Exceptional $49,303 |
| Immigrants | North America | 99.8 /100 | #73 | Exceptional $49,302 |
| Mongolians | 99.8 /100 | #74 | Exceptional $49,173 |