Soviet Union vs Immigrants from Romania Per Capita Income
COMPARE
Soviet Union
Immigrants from Romania
Per Capita Income
Per Capita Income Comparison
Soviet Union
Immigrants from Romania
$54,202
PER CAPITA INCOME
100.0/ 100
METRIC RATING
20th/ 347
METRIC RANK
$49,463
PER CAPITA INCOME
99.9/ 100
METRIC RATING
67th/ 347
METRIC RANK
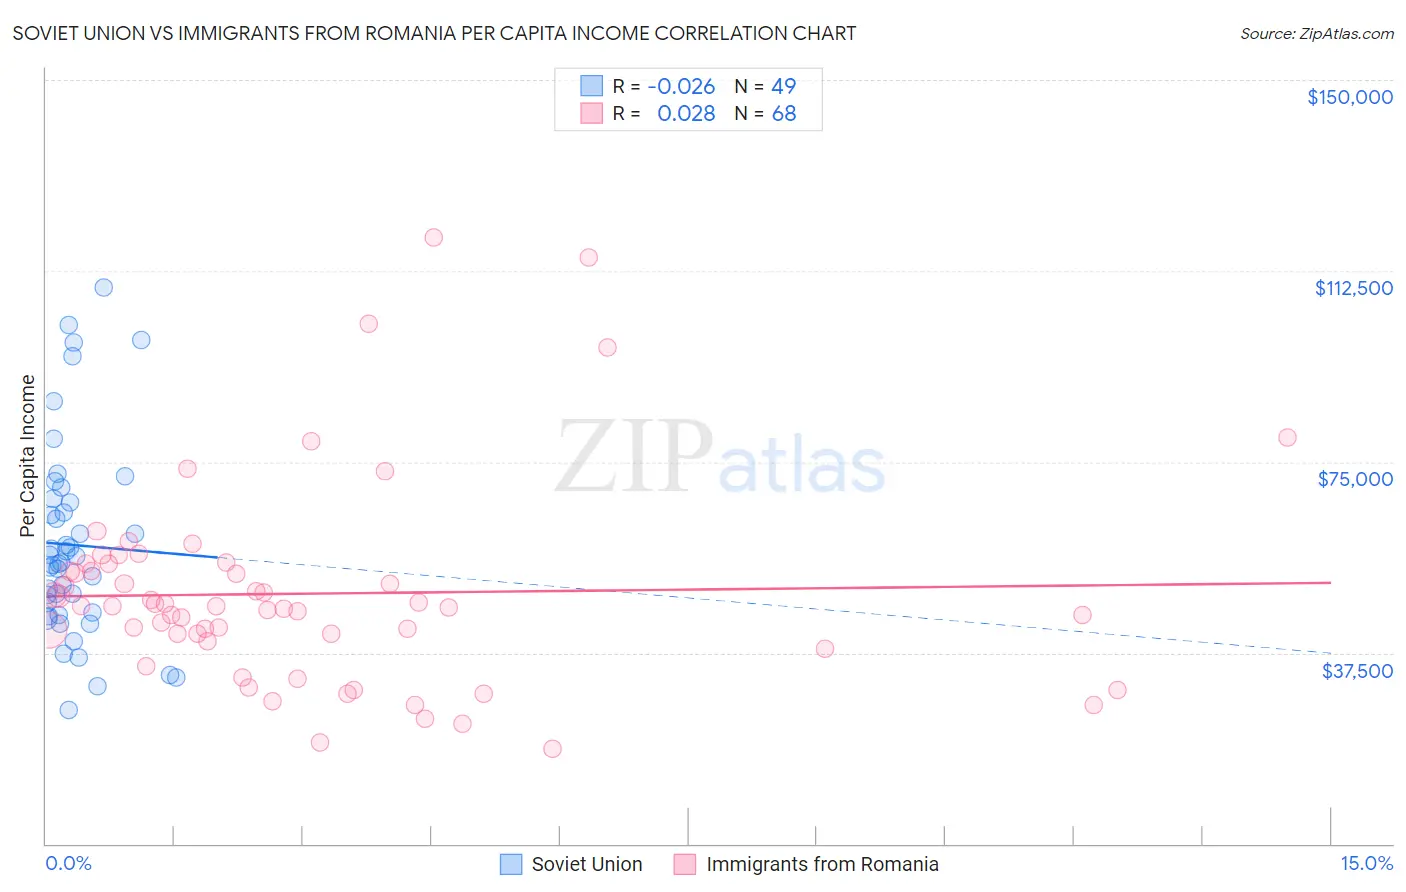
Soviet Union vs Immigrants from Romania Per Capita Income Correlation Chart
The statistical analysis conducted on geographies consisting of 43,511,973 people shows no correlation between the proportion of Soviet Union and per capita income in the United States with a correlation coefficient (R) of -0.026 and weighted average of $54,202. Similarly, the statistical analysis conducted on geographies consisting of 256,972,544 people shows no correlation between the proportion of Immigrants from Romania and per capita income in the United States with a correlation coefficient (R) of 0.028 and weighted average of $49,463, a difference of 9.6%.
Per Capita Income Correlation Summary
| Measurement | Soviet Union | Immigrants from Romania |
| Minimum | $26,314 | $18,731 |
| Maximum | $109,367 | $119,092 |
| Range | $83,053 | $100,361 |
| Mean | $58,669 | $49,122 |
| Median | $55,152 | $46,712 |
| Interquartile 25% (IQ1) | $45,115 | $40,435 |
| Interquartile 75% (IQ3) | $67,421 | $54,228 |
| Interquartile Range (IQR) | $22,306 | $13,794 |
| Standard Deviation (Sample) | $19,133 | $19,681 |
| Standard Deviation (Population) | $18,936 | $19,535 |
Similar Demographics by Per Capita Income
Demographics Similar to Soviet Union by Per Capita Income
In terms of per capita income, the demographic groups most similar to Soviet Union are Immigrants from Northern Europe ($54,159, a difference of 0.080%), Immigrants from China ($54,264, a difference of 0.11%), Thai ($54,307, a difference of 0.19%), Indian (Asian) ($53,874, a difference of 0.61%), and Immigrants from France ($54,557, a difference of 0.65%).
| Demographics | Rating | Rank | Per Capita Income |
| Immigrants | India | 100.0 /100 | #13 | Exceptional $55,268 |
| Immigrants | Belgium | 100.0 /100 | #14 | Exceptional $55,082 |
| Cypriots | 100.0 /100 | #15 | Exceptional $54,899 |
| Immigrants | Switzerland | 100.0 /100 | #16 | Exceptional $54,866 |
| Immigrants | France | 100.0 /100 | #17 | Exceptional $54,557 |
| Thais | 100.0 /100 | #18 | Exceptional $54,307 |
| Immigrants | China | 100.0 /100 | #19 | Exceptional $54,264 |
| Soviet Union | 100.0 /100 | #20 | Exceptional $54,202 |
| Immigrants | Northern Europe | 100.0 /100 | #21 | Exceptional $54,159 |
| Indians (Asian) | 100.0 /100 | #22 | Exceptional $53,874 |
| Immigrants | Eastern Asia | 100.0 /100 | #23 | Exceptional $53,806 |
| Immigrants | Denmark | 100.0 /100 | #24 | Exceptional $53,799 |
| Immigrants | Japan | 100.0 /100 | #25 | Exceptional $53,359 |
| Russians | 100.0 /100 | #26 | Exceptional $53,154 |
| Immigrants | South Central Asia | 100.0 /100 | #27 | Exceptional $52,660 |
Demographics Similar to Immigrants from Romania by Per Capita Income
In terms of per capita income, the demographic groups most similar to Immigrants from Romania are Lithuanian ($49,448, a difference of 0.030%), Immigrants from Bulgaria ($49,482, a difference of 0.040%), Immigrants from Canada ($49,412, a difference of 0.10%), Bolivian ($49,526, a difference of 0.13%), and Immigrants from Eastern Europe ($49,316, a difference of 0.30%).
| Demographics | Rating | Rank | Per Capita Income |
| Immigrants | Scotland | 99.9 /100 | #60 | Exceptional $49,893 |
| Argentineans | 99.9 /100 | #61 | Exceptional $49,862 |
| Immigrants | Asia | 99.9 /100 | #62 | Exceptional $49,741 |
| Maltese | 99.9 /100 | #63 | Exceptional $49,640 |
| Immigrants | Argentina | 99.9 /100 | #64 | Exceptional $49,627 |
| Bolivians | 99.9 /100 | #65 | Exceptional $49,526 |
| Immigrants | Bulgaria | 99.9 /100 | #66 | Exceptional $49,482 |
| Immigrants | Romania | 99.9 /100 | #67 | Exceptional $49,463 |
| Lithuanians | 99.8 /100 | #68 | Exceptional $49,448 |
| Immigrants | Canada | 99.8 /100 | #69 | Exceptional $49,412 |
| Immigrants | Eastern Europe | 99.8 /100 | #70 | Exceptional $49,316 |
| Greeks | 99.8 /100 | #71 | Exceptional $49,309 |
| Immigrants | Hungary | 99.8 /100 | #72 | Exceptional $49,303 |
| Immigrants | North America | 99.8 /100 | #73 | Exceptional $49,302 |
| Mongolians | 99.8 /100 | #74 | Exceptional $49,173 |