Belgian vs Immigrants from Brazil Single Male Poverty
COMPARE
Belgian
Immigrants from Brazil
Single Male Poverty
Single Male Poverty Comparison
Belgians
Immigrants from Brazil
13.5%
SINGLE MALE POVERTY
1.2/ 100
METRIC RATING
247th/ 347
METRIC RANK
11.7%
SINGLE MALE POVERTY
99.8/ 100
METRIC RATING
58th/ 347
METRIC RANK
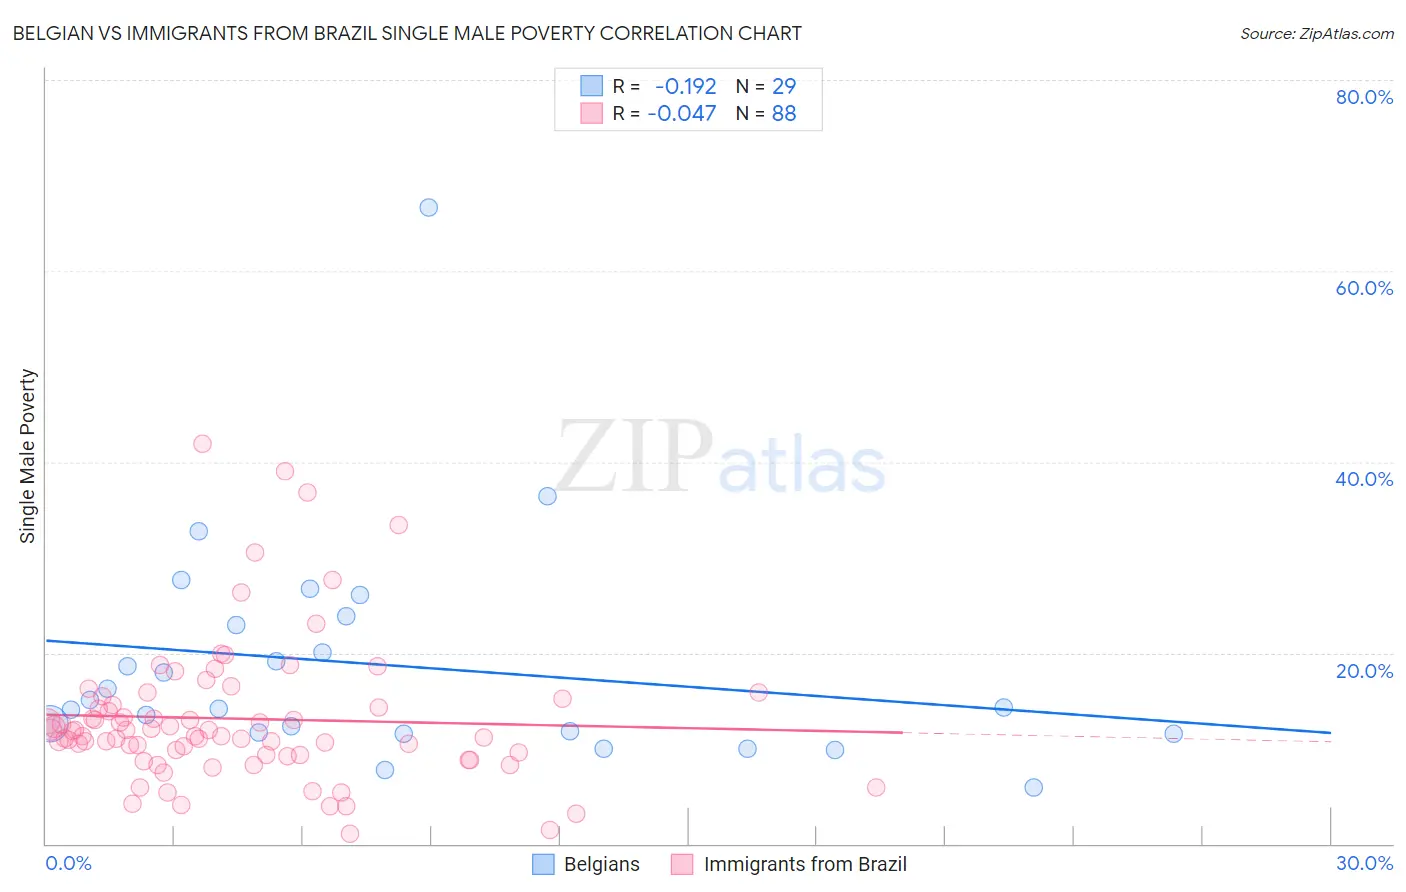
Belgian vs Immigrants from Brazil Single Male Poverty Correlation Chart
The statistical analysis conducted on geographies consisting of 312,309,142 people shows a poor negative correlation between the proportion of Belgians and poverty level among single males in the United States with a correlation coefficient (R) of -0.192 and weighted average of 13.5%. Similarly, the statistical analysis conducted on geographies consisting of 304,479,372 people shows no correlation between the proportion of Immigrants from Brazil and poverty level among single males in the United States with a correlation coefficient (R) of -0.047 and weighted average of 11.7%, a difference of 15.3%.
Single Male Poverty Correlation Summary
| Measurement | Belgian | Immigrants from Brazil |
| Minimum | 5.9% | 1.1% |
| Maximum | 66.7% | 41.8% |
| Range | 60.8% | 40.8% |
| Mean | 18.6% | 13.1% |
| Median | 14.3% | 11.5% |
| Interquartile 25% (IQ1) | 11.6% | 9.3% |
| Interquartile 75% (IQ3) | 23.4% | 14.9% |
| Interquartile Range (IQR) | 11.7% | 5.6% |
| Standard Deviation (Sample) | 11.9% | 7.5% |
| Standard Deviation (Population) | 11.7% | 7.5% |
Similar Demographics by Single Male Poverty
Demographics Similar to Belgians by Single Male Poverty
In terms of single male poverty, the demographic groups most similar to Belgians are Immigrants from Micronesia (13.5%, a difference of 0.010%), Czech (13.5%, a difference of 0.030%), Immigrants from Latin America (13.5%, a difference of 0.12%), Spanish (13.6%, a difference of 0.27%), and Immigrants from Somalia (13.6%, a difference of 0.29%).
| Demographics | Rating | Rank | Single Male Poverty |
| Belizeans | 2.3 /100 | #240 | Tragic 13.4% |
| Immigrants | Germany | 2.1 /100 | #241 | Tragic 13.4% |
| Carpatho Rusyns | 2.1 /100 | #242 | Tragic 13.4% |
| Barbadians | 2.1 /100 | #243 | Tragic 13.4% |
| Immigrants | Senegal | 1.7 /100 | #244 | Tragic 13.5% |
| Immigrants | Latin America | 1.3 /100 | #245 | Tragic 13.5% |
| Immigrants | Micronesia | 1.2 /100 | #246 | Tragic 13.5% |
| Belgians | 1.2 /100 | #247 | Tragic 13.5% |
| Czechs | 1.2 /100 | #248 | Tragic 13.5% |
| Spanish | 1.0 /100 | #249 | Tragic 13.6% |
| Immigrants | Somalia | 1.0 /100 | #250 | Tragic 13.6% |
| Immigrants | Zaire | 0.9 /100 | #251 | Tragic 13.6% |
| Finns | 0.9 /100 | #252 | Tragic 13.6% |
| German Russians | 0.8 /100 | #253 | Tragic 13.6% |
| Sub-Saharan Africans | 0.5 /100 | #254 | Tragic 13.7% |
Demographics Similar to Immigrants from Brazil by Single Male Poverty
In terms of single male poverty, the demographic groups most similar to Immigrants from Brazil are Immigrants from Romania (11.7%, a difference of 0.020%), Brazilian (11.8%, a difference of 0.080%), Burmese (11.7%, a difference of 0.17%), Peruvian (11.8%, a difference of 0.29%), and Cambodian (11.8%, a difference of 0.32%).
| Demographics | Rating | Rank | Single Male Poverty |
| Paraguayans | 99.9 /100 | #51 | Exceptional 11.6% |
| Samoans | 99.9 /100 | #52 | Exceptional 11.7% |
| Bulgarians | 99.9 /100 | #53 | Exceptional 11.7% |
| Immigrants | Uzbekistan | 99.9 /100 | #54 | Exceptional 11.7% |
| Cypriots | 99.9 /100 | #55 | Exceptional 11.7% |
| Burmese | 99.8 /100 | #56 | Exceptional 11.7% |
| Immigrants | Romania | 99.8 /100 | #57 | Exceptional 11.7% |
| Immigrants | Brazil | 99.8 /100 | #58 | Exceptional 11.7% |
| Brazilians | 99.8 /100 | #59 | Exceptional 11.8% |
| Peruvians | 99.8 /100 | #60 | Exceptional 11.8% |
| Cambodians | 99.8 /100 | #61 | Exceptional 11.8% |
| Immigrants | Sri Lanka | 99.7 /100 | #62 | Exceptional 11.8% |
| Immigrants | Belarus | 99.7 /100 | #63 | Exceptional 11.8% |
| Immigrants | Eastern Europe | 99.6 /100 | #64 | Exceptional 11.8% |
| Laotians | 99.6 /100 | #65 | Exceptional 11.9% |