Irish vs Alaskan Athabascan Per Capita Income
COMPARE
Irish
Alaskan Athabascan
Per Capita Income
Per Capita Income Comparison
Irish
Alaskan Athabascans
$44,679
PER CAPITA INCOME
75.8/ 100
METRIC RATING
146th/ 347
METRIC RANK
$39,163
PER CAPITA INCOME
0.6/ 100
METRIC RATING
260th/ 347
METRIC RANK
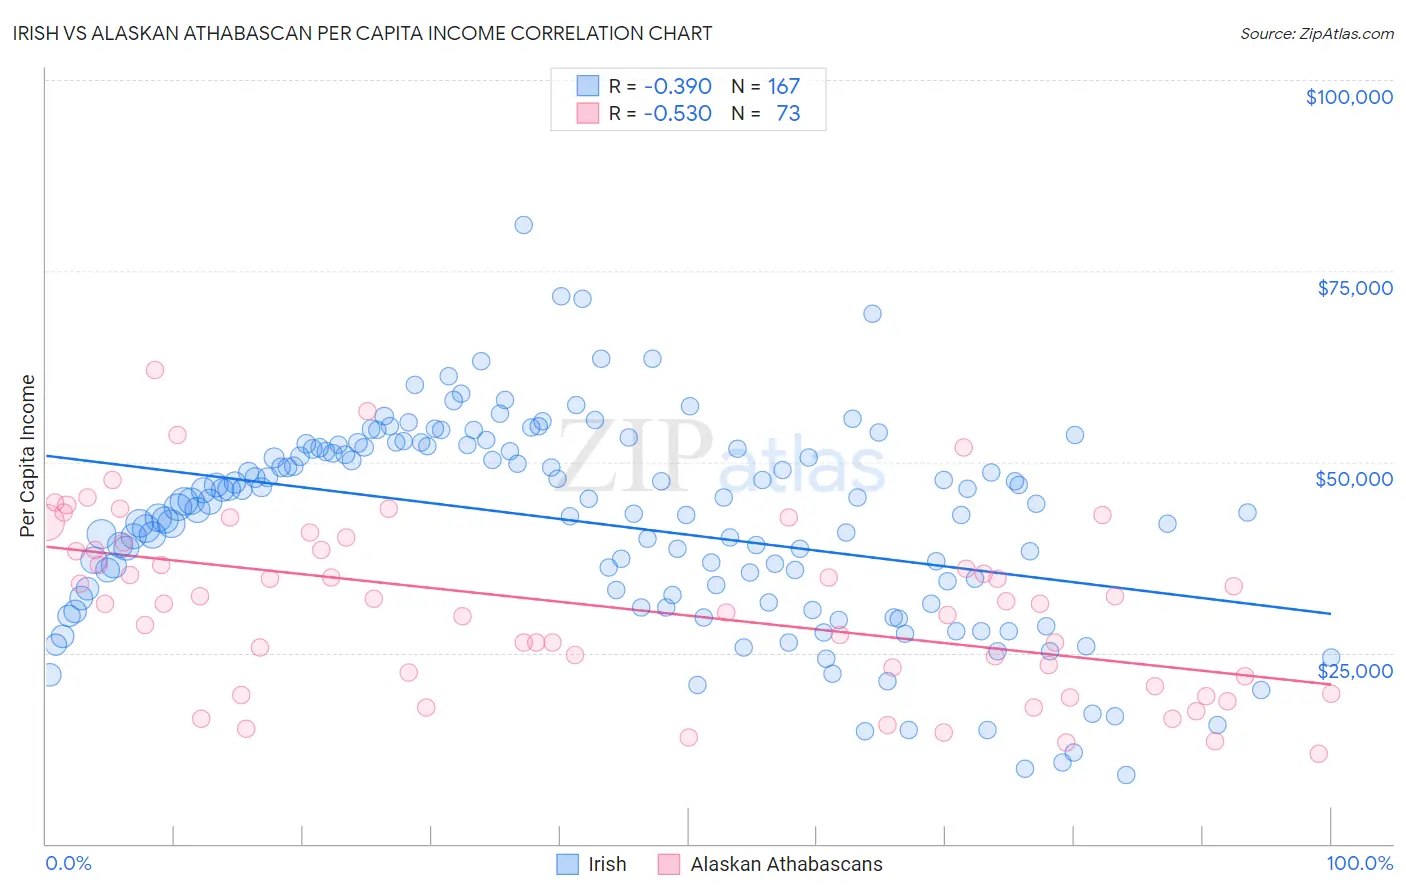
Irish vs Alaskan Athabascan Per Capita Income Correlation Chart
The statistical analysis conducted on geographies consisting of 580,769,300 people shows a mild negative correlation between the proportion of Irish and per capita income in the United States with a correlation coefficient (R) of -0.390 and weighted average of $44,679. Similarly, the statistical analysis conducted on geographies consisting of 45,821,401 people shows a substantial negative correlation between the proportion of Alaskan Athabascans and per capita income in the United States with a correlation coefficient (R) of -0.530 and weighted average of $39,163, a difference of 14.1%.
Per Capita Income Correlation Summary
| Measurement | Irish | Alaskan Athabascan |
| Minimum | $9,015 | $11,811 |
| Maximum | $80,942 | $61,991 |
| Range | $71,927 | $50,180 |
| Mean | $42,054 | $31,098 |
| Median | $44,449 | $31,460 |
| Interquartile 25% (IQ1) | $32,164 | $21,337 |
| Interquartile 75% (IQ3) | $51,890 | $38,931 |
| Interquartile Range (IQR) | $19,726 | $17,594 |
| Standard Deviation (Sample) | $13,324 | $11,398 |
| Standard Deviation (Population) | $13,284 | $11,320 |
Similar Demographics by Per Capita Income
Demographics Similar to Irish by Per Capita Income
In terms of per capita income, the demographic groups most similar to Irish are Czech ($44,595, a difference of 0.19%), Immigrants from Afghanistan ($44,790, a difference of 0.25%), Immigrants from Armenia ($44,552, a difference of 0.28%), Korean ($44,522, a difference of 0.35%), and Immigrants from Eritrea ($44,509, a difference of 0.38%).
| Demographics | Rating | Rank | Per Capita Income |
| Basques | 83.2 /100 | #139 | Excellent $45,086 |
| Immigrants | Jordan | 82.9 /100 | #140 | Excellent $45,066 |
| Slavs | 82.6 /100 | #141 | Excellent $45,049 |
| Ugandans | 82.6 /100 | #142 | Excellent $45,047 |
| Immigrants | Uganda | 82.5 /100 | #143 | Excellent $45,043 |
| Icelanders | 81.6 /100 | #144 | Excellent $44,987 |
| Immigrants | Afghanistan | 78.0 /100 | #145 | Good $44,790 |
| Irish | 75.8 /100 | #146 | Good $44,679 |
| Czechs | 74.1 /100 | #147 | Good $44,595 |
| Immigrants | Armenia | 73.1 /100 | #148 | Good $44,552 |
| Koreans | 72.5 /100 | #149 | Good $44,522 |
| Immigrants | Eritrea | 72.1 /100 | #150 | Good $44,509 |
| Norwegians | 71.5 /100 | #151 | Good $44,480 |
| Peruvians | 71.5 /100 | #152 | Good $44,479 |
| Scottish | 70.6 /100 | #153 | Good $44,440 |
Demographics Similar to Alaskan Athabascans by Per Capita Income
In terms of per capita income, the demographic groups most similar to Alaskan Athabascans are Malaysian ($39,194, a difference of 0.080%), Marshallese ($39,108, a difference of 0.14%), Iroquois ($39,104, a difference of 0.15%), Jamaican ($39,231, a difference of 0.17%), and Belizean ($39,097, a difference of 0.17%).
| Demographics | Rating | Rank | Per Capita Income |
| Osage | 1.0 /100 | #253 | Tragic $39,568 |
| Alaska Natives | 1.0 /100 | #254 | Tragic $39,558 |
| Immigrants | Middle Africa | 1.0 /100 | #255 | Tragic $39,529 |
| Hawaiians | 0.8 /100 | #256 | Tragic $39,403 |
| Nicaraguans | 0.8 /100 | #257 | Tragic $39,372 |
| Jamaicans | 0.7 /100 | #258 | Tragic $39,231 |
| Malaysians | 0.7 /100 | #259 | Tragic $39,194 |
| Alaskan Athabascans | 0.6 /100 | #260 | Tragic $39,163 |
| Marshallese | 0.6 /100 | #261 | Tragic $39,108 |
| Iroquois | 0.6 /100 | #262 | Tragic $39,104 |
| Belizeans | 0.6 /100 | #263 | Tragic $39,097 |
| Americans | 0.6 /100 | #264 | Tragic $39,039 |
| Spanish Americans | 0.5 /100 | #265 | Tragic $39,012 |
| Salvadorans | 0.5 /100 | #266 | Tragic $38,858 |
| Immigrants | Zaire | 0.4 /100 | #267 | Tragic $38,848 |