Immigrants from El Salvador vs Alaskan Athabascan Per Capita Income
COMPARE
Immigrants from El Salvador
Alaskan Athabascan
Per Capita Income
Per Capita Income Comparison
Immigrants from El Salvador
Alaskan Athabascans
$38,394
PER CAPITA INCOME
0.3/ 100
METRIC RATING
274th/ 347
METRIC RANK
$39,163
PER CAPITA INCOME
0.6/ 100
METRIC RATING
260th/ 347
METRIC RANK
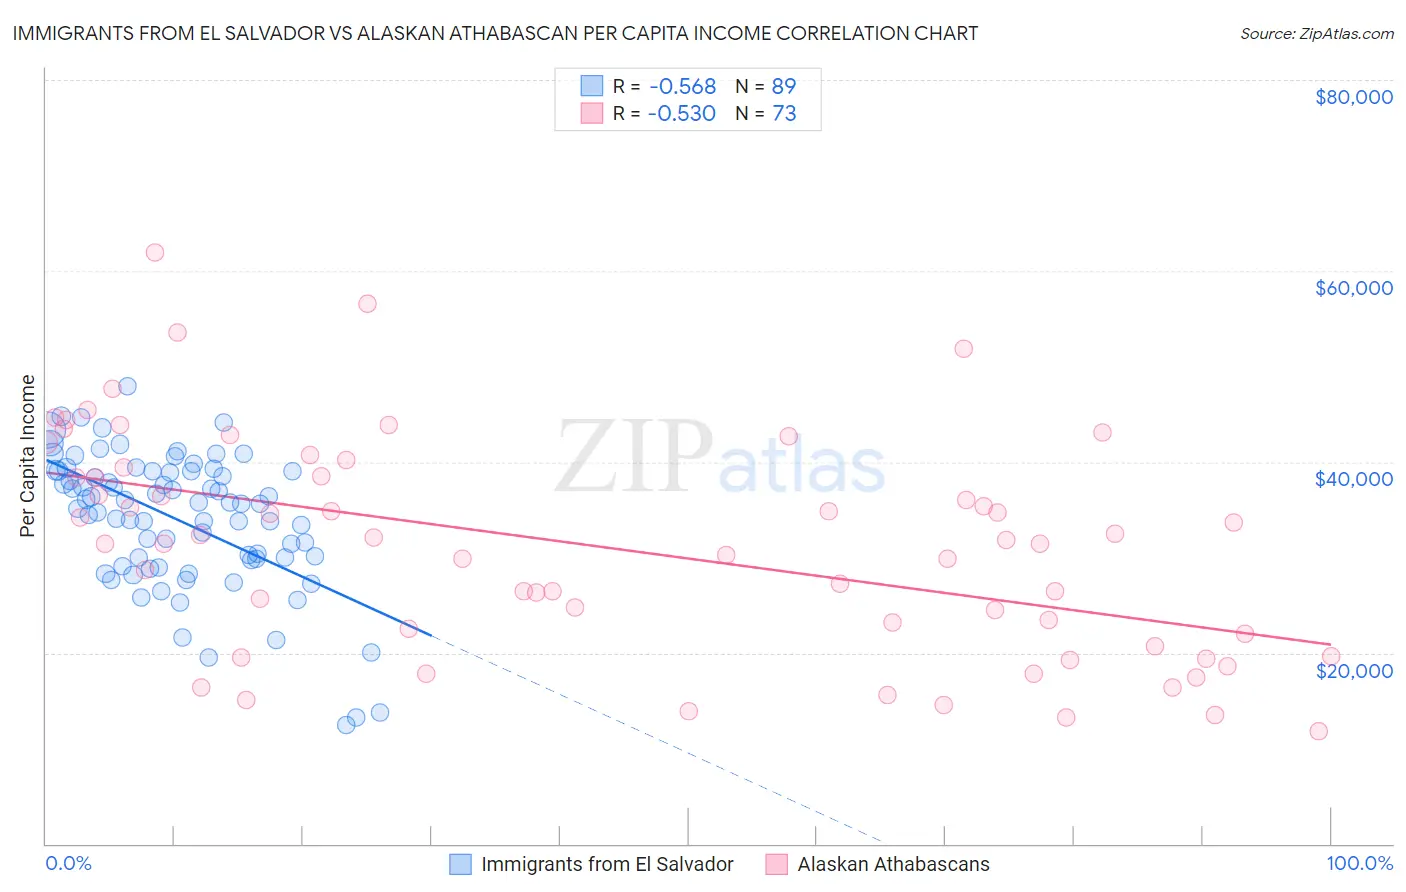
Immigrants from El Salvador vs Alaskan Athabascan Per Capita Income Correlation Chart
The statistical analysis conducted on geographies consisting of 357,847,435 people shows a substantial negative correlation between the proportion of Immigrants from El Salvador and per capita income in the United States with a correlation coefficient (R) of -0.568 and weighted average of $38,394. Similarly, the statistical analysis conducted on geographies consisting of 45,821,401 people shows a substantial negative correlation between the proportion of Alaskan Athabascans and per capita income in the United States with a correlation coefficient (R) of -0.530 and weighted average of $39,163, a difference of 2.0%.
Per Capita Income Correlation Summary
| Measurement | Immigrants from El Salvador | Alaskan Athabascan |
| Minimum | $12,473 | $11,811 |
| Maximum | $47,918 | $61,991 |
| Range | $35,445 | $50,180 |
| Mean | $33,959 | $31,098 |
| Median | $35,640 | $31,460 |
| Interquartile 25% (IQ1) | $29,770 | $21,337 |
| Interquartile 75% (IQ3) | $39,011 | $38,931 |
| Interquartile Range (IQR) | $9,240 | $17,594 |
| Standard Deviation (Sample) | $7,077 | $11,398 |
| Standard Deviation (Population) | $7,037 | $11,320 |
Demographics Similar to Immigrants from El Salvador and Alaskan Athabascans by Per Capita Income
In terms of per capita income, the demographic groups most similar to Immigrants from El Salvador are Nepalese ($38,442, a difference of 0.13%), Immigrants from Cabo Verde ($38,540, a difference of 0.38%), Central American ($38,560, a difference of 0.43%), Immigrants from Belize ($38,614, a difference of 0.57%), and Immigrants from Liberia ($38,165, a difference of 0.60%). Similarly, the demographic groups most similar to Alaskan Athabascans are Malaysian ($39,194, a difference of 0.080%), Marshallese ($39,108, a difference of 0.14%), Iroquois ($39,104, a difference of 0.15%), Jamaican ($39,231, a difference of 0.17%), and Belizean ($39,097, a difference of 0.17%).
| Demographics | Rating | Rank | Per Capita Income |
| Nicaraguans | 0.8 /100 | #257 | Tragic $39,372 |
| Jamaicans | 0.7 /100 | #258 | Tragic $39,231 |
| Malaysians | 0.7 /100 | #259 | Tragic $39,194 |
| Alaskan Athabascans | 0.6 /100 | #260 | Tragic $39,163 |
| Marshallese | 0.6 /100 | #261 | Tragic $39,108 |
| Iroquois | 0.6 /100 | #262 | Tragic $39,104 |
| Belizeans | 0.6 /100 | #263 | Tragic $39,097 |
| Americans | 0.6 /100 | #264 | Tragic $39,039 |
| Spanish Americans | 0.5 /100 | #265 | Tragic $39,012 |
| Salvadorans | 0.5 /100 | #266 | Tragic $38,858 |
| Immigrants | Zaire | 0.4 /100 | #267 | Tragic $38,848 |
| Liberians | 0.4 /100 | #268 | Tragic $38,780 |
| Immigrants | Jamaica | 0.4 /100 | #269 | Tragic $38,766 |
| Immigrants | Belize | 0.3 /100 | #270 | Tragic $38,614 |
| Central Americans | 0.3 /100 | #271 | Tragic $38,560 |
| Immigrants | Cabo Verde | 0.3 /100 | #272 | Tragic $38,540 |
| Nepalese | 0.3 /100 | #273 | Tragic $38,442 |
| Immigrants | El Salvador | 0.3 /100 | #274 | Tragic $38,394 |
| Immigrants | Liberia | 0.2 /100 | #275 | Tragic $38,165 |
| Hmong | 0.2 /100 | #276 | Tragic $38,120 |
| Comanche | 0.2 /100 | #277 | Tragic $38,088 |