Basque vs Iranian Per Capita Income
COMPARE
Basque
Iranian
Per Capita Income
Per Capita Income Comparison
Basques
Iranians
$45,086
PER CAPITA INCOME
83.2/ 100
METRIC RATING
139th/ 347
METRIC RANK
$58,786
PER CAPITA INCOME
100.0/ 100
METRIC RATING
2nd/ 347
METRIC RANK
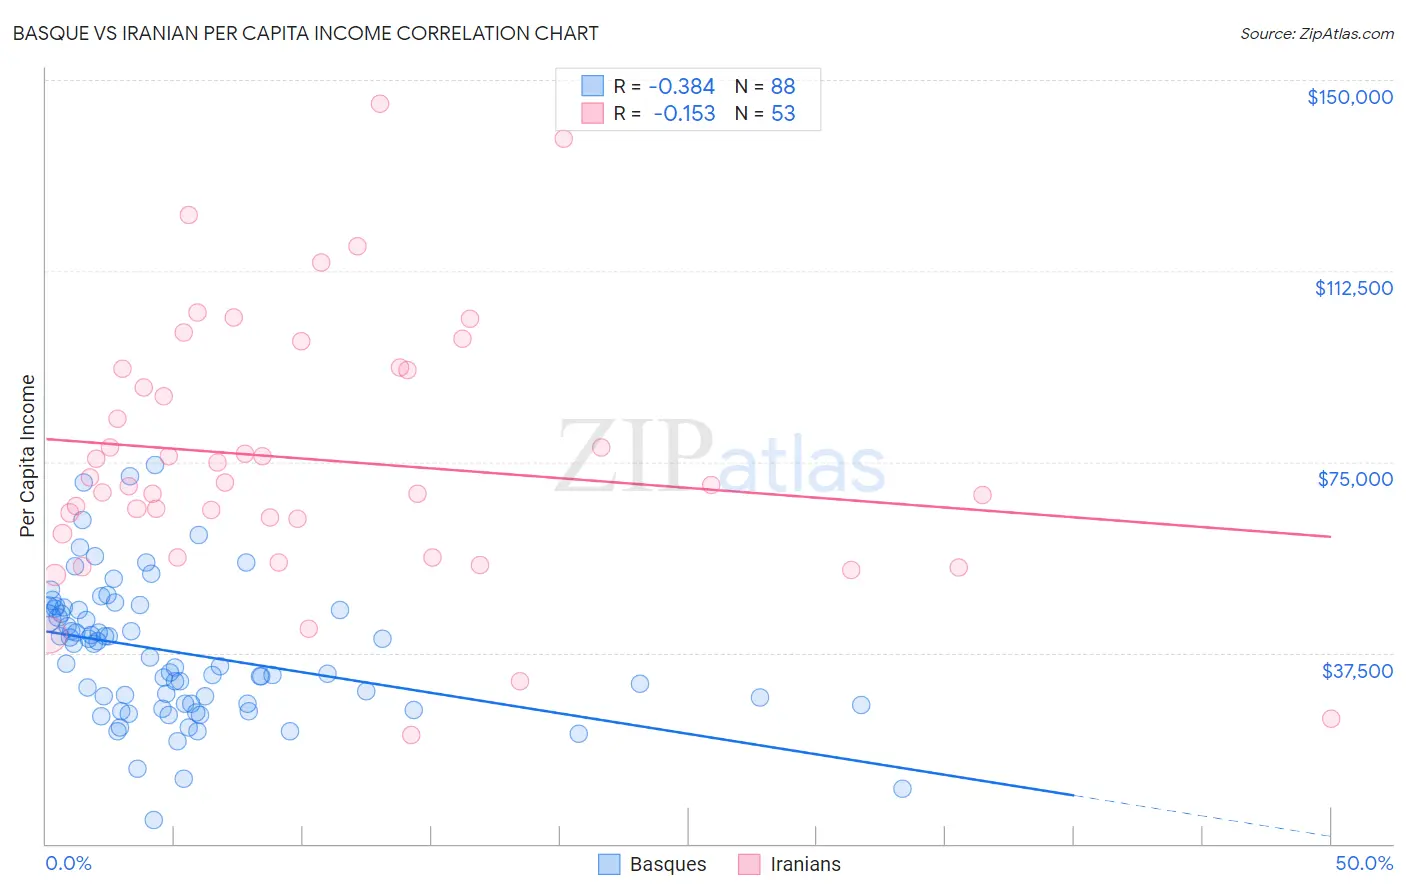
Basque vs Iranian Per Capita Income Correlation Chart
The statistical analysis conducted on geographies consisting of 165,779,827 people shows a mild negative correlation between the proportion of Basques and per capita income in the United States with a correlation coefficient (R) of -0.384 and weighted average of $45,086. Similarly, the statistical analysis conducted on geographies consisting of 316,916,136 people shows a poor negative correlation between the proportion of Iranians and per capita income in the United States with a correlation coefficient (R) of -0.153 and weighted average of $58,786, a difference of 30.4%.
Per Capita Income Correlation Summary
| Measurement | Basque | Iranian |
| Minimum | $4,617 | $21,346 |
| Maximum | $74,412 | $145,312 |
| Range | $69,795 | $123,966 |
| Mean | $37,448 | $75,439 |
| Median | $35,882 | $70,507 |
| Interquartile 25% (IQ1) | $27,463 | $58,523 |
| Interquartile 75% (IQ3) | $46,112 | $93,126 |
| Interquartile Range (IQR) | $18,649 | $34,604 |
| Standard Deviation (Sample) | $13,380 | $25,681 |
| Standard Deviation (Population) | $13,304 | $25,438 |
Similar Demographics by Per Capita Income
Demographics Similar to Basques by Per Capita Income
In terms of per capita income, the demographic groups most similar to Basques are Immigrants from Jordan ($45,066, a difference of 0.050%), Slavic ($45,049, a difference of 0.080%), Ugandan ($45,047, a difference of 0.090%), Immigrants from Uganda ($45,043, a difference of 0.10%), and Icelander ($44,987, a difference of 0.22%).
| Demographics | Rating | Rank | Per Capita Income |
| Jordanians | 89.9 /100 | #132 | Excellent $45,605 |
| Pakistanis | 89.7 /100 | #133 | Excellent $45,587 |
| Slovenes | 89.6 /100 | #134 | Excellent $45,581 |
| Hungarians | 87.9 /100 | #135 | Excellent $45,426 |
| Immigrants | Oceania | 85.2 /100 | #136 | Excellent $45,220 |
| Immigrants | Syria | 85.2 /100 | #137 | Excellent $45,218 |
| Assyrians/Chaldeans/Syriacs | 84.8 /100 | #138 | Excellent $45,195 |
| Basques | 83.2 /100 | #139 | Excellent $45,086 |
| Immigrants | Jordan | 82.9 /100 | #140 | Excellent $45,066 |
| Slavs | 82.6 /100 | #141 | Excellent $45,049 |
| Ugandans | 82.6 /100 | #142 | Excellent $45,047 |
| Immigrants | Uganda | 82.5 /100 | #143 | Excellent $45,043 |
| Icelanders | 81.6 /100 | #144 | Excellent $44,987 |
| Immigrants | Afghanistan | 78.0 /100 | #145 | Good $44,790 |
| Irish | 75.8 /100 | #146 | Good $44,679 |
Demographics Similar to Iranians by Per Capita Income
In terms of per capita income, the demographic groups most similar to Iranians are Filipino ($59,066, a difference of 0.48%), Immigrants from Singapore ($58,353, a difference of 0.74%), Immigrants from Australia ($57,953, a difference of 1.4%), Immigrants from Iran ($57,759, a difference of 1.8%), and Immigrants from Taiwan ($57,742, a difference of 1.8%).
| Demographics | Rating | Rank | Per Capita Income |
| Filipinos | 100.0 /100 | #1 | Exceptional $59,066 |
| Iranians | 100.0 /100 | #2 | Exceptional $58,786 |
| Immigrants | Singapore | 100.0 /100 | #3 | Exceptional $58,353 |
| Immigrants | Australia | 100.0 /100 | #4 | Exceptional $57,953 |
| Immigrants | Iran | 100.0 /100 | #5 | Exceptional $57,759 |
| Immigrants | Taiwan | 100.0 /100 | #6 | Exceptional $57,742 |
| Immigrants | Israel | 100.0 /100 | #7 | Exceptional $57,384 |
| Immigrants | Hong Kong | 100.0 /100 | #8 | Exceptional $56,709 |
| Immigrants | Ireland | 100.0 /100 | #9 | Exceptional $56,584 |
| Okinawans | 100.0 /100 | #10 | Exceptional $55,817 |
| Eastern Europeans | 100.0 /100 | #11 | Exceptional $55,780 |
| Immigrants | Sweden | 100.0 /100 | #12 | Exceptional $55,582 |
| Immigrants | India | 100.0 /100 | #13 | Exceptional $55,268 |
| Immigrants | Belgium | 100.0 /100 | #14 | Exceptional $55,082 |
| Cypriots | 100.0 /100 | #15 | Exceptional $54,899 |