Burmese vs Iranian Per Capita Income
COMPARE
Burmese
Iranian
Per Capita Income
Per Capita Income Comparison
Burmese
Iranians
$52,005
PER CAPITA INCOME
100.0/ 100
METRIC RATING
35th/ 347
METRIC RANK
$58,786
PER CAPITA INCOME
100.0/ 100
METRIC RATING
2nd/ 347
METRIC RANK
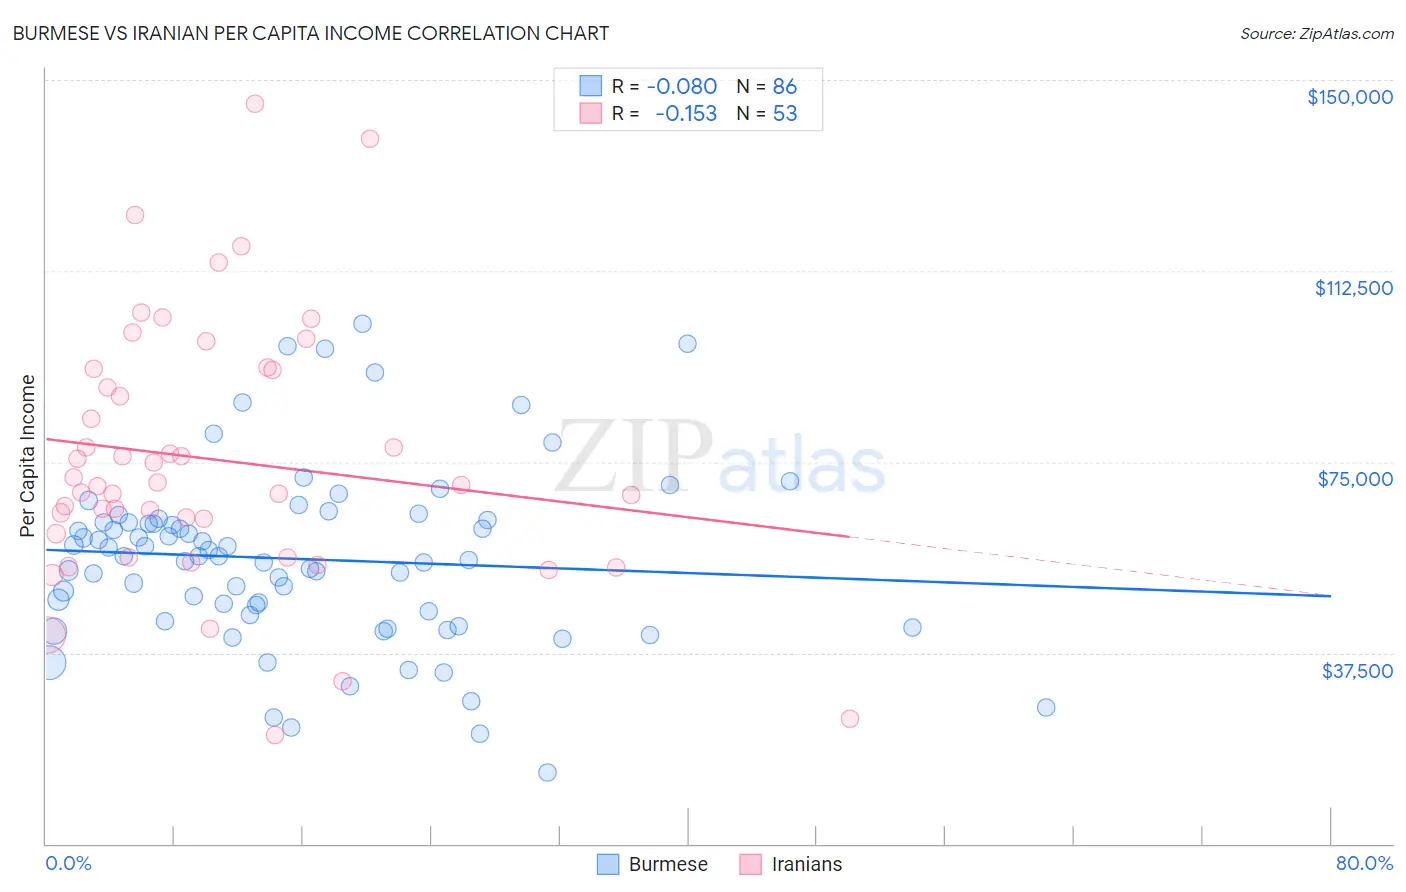
Burmese vs Iranian Per Capita Income Correlation Chart
The statistical analysis conducted on geographies consisting of 465,453,233 people shows a slight negative correlation between the proportion of Burmese and per capita income in the United States with a correlation coefficient (R) of -0.080 and weighted average of $52,005. Similarly, the statistical analysis conducted on geographies consisting of 316,916,136 people shows a poor negative correlation between the proportion of Iranians and per capita income in the United States with a correlation coefficient (R) of -0.153 and weighted average of $58,786, a difference of 13.0%.
Per Capita Income Correlation Summary
| Measurement | Burmese | Iranian |
| Minimum | $14,082 | $21,346 |
| Maximum | $102,113 | $145,312 |
| Range | $88,031 | $123,966 |
| Mean | $55,927 | $75,439 |
| Median | $56,416 | $70,507 |
| Interquartile 25% (IQ1) | $45,035 | $58,523 |
| Interquartile 75% (IQ3) | $63,196 | $93,126 |
| Interquartile Range (IQR) | $18,162 | $34,604 |
| Standard Deviation (Sample) | $17,378 | $25,681 |
| Standard Deviation (Population) | $17,276 | $25,438 |
Similar Demographics by Per Capita Income
Demographics Similar to Burmese by Per Capita Income
In terms of per capita income, the demographic groups most similar to Burmese are Immigrants from Russia ($52,044, a difference of 0.070%), Australian ($52,074, a difference of 0.13%), Immigrants from Greece ($51,891, a difference of 0.22%), Estonian ($51,875, a difference of 0.25%), and Immigrants from Norway ($52,217, a difference of 0.41%).
| Demographics | Rating | Rank | Per Capita Income |
| Latvians | 100.0 /100 | #28 | Exceptional $52,649 |
| Israelis | 100.0 /100 | #29 | Exceptional $52,596 |
| Immigrants | Austria | 100.0 /100 | #30 | Exceptional $52,503 |
| Turks | 100.0 /100 | #31 | Exceptional $52,391 |
| Immigrants | Norway | 100.0 /100 | #32 | Exceptional $52,217 |
| Australians | 100.0 /100 | #33 | Exceptional $52,074 |
| Immigrants | Russia | 100.0 /100 | #34 | Exceptional $52,044 |
| Burmese | 100.0 /100 | #35 | Exceptional $52,005 |
| Immigrants | Greece | 100.0 /100 | #36 | Exceptional $51,891 |
| Estonians | 100.0 /100 | #37 | Exceptional $51,875 |
| Immigrants | Czechoslovakia | 100.0 /100 | #38 | Exceptional $51,770 |
| Cambodians | 100.0 /100 | #39 | Exceptional $51,731 |
| Immigrants | Korea | 100.0 /100 | #40 | Exceptional $51,671 |
| Immigrants | South Africa | 100.0 /100 | #41 | Exceptional $51,465 |
| Immigrants | Turkey | 100.0 /100 | #42 | Exceptional $51,368 |
Demographics Similar to Iranians by Per Capita Income
In terms of per capita income, the demographic groups most similar to Iranians are Filipino ($59,066, a difference of 0.48%), Immigrants from Singapore ($58,353, a difference of 0.74%), Immigrants from Australia ($57,953, a difference of 1.4%), Immigrants from Iran ($57,759, a difference of 1.8%), and Immigrants from Taiwan ($57,742, a difference of 1.8%).
| Demographics | Rating | Rank | Per Capita Income |
| Filipinos | 100.0 /100 | #1 | Exceptional $59,066 |
| Iranians | 100.0 /100 | #2 | Exceptional $58,786 |
| Immigrants | Singapore | 100.0 /100 | #3 | Exceptional $58,353 |
| Immigrants | Australia | 100.0 /100 | #4 | Exceptional $57,953 |
| Immigrants | Iran | 100.0 /100 | #5 | Exceptional $57,759 |
| Immigrants | Taiwan | 100.0 /100 | #6 | Exceptional $57,742 |
| Immigrants | Israel | 100.0 /100 | #7 | Exceptional $57,384 |
| Immigrants | Hong Kong | 100.0 /100 | #8 | Exceptional $56,709 |
| Immigrants | Ireland | 100.0 /100 | #9 | Exceptional $56,584 |
| Okinawans | 100.0 /100 | #10 | Exceptional $55,817 |
| Eastern Europeans | 100.0 /100 | #11 | Exceptional $55,780 |
| Immigrants | Sweden | 100.0 /100 | #12 | Exceptional $55,582 |
| Immigrants | India | 100.0 /100 | #13 | Exceptional $55,268 |
| Immigrants | Belgium | 100.0 /100 | #14 | Exceptional $55,082 |
| Cypriots | 100.0 /100 | #15 | Exceptional $54,899 |