Peruvian vs Iranian Per Capita Income
COMPARE
Peruvian
Iranian
Per Capita Income
Per Capita Income Comparison
Peruvians
Iranians
$44,479
PER CAPITA INCOME
71.5/ 100
METRIC RATING
152nd/ 347
METRIC RANK
$58,786
PER CAPITA INCOME
100.0/ 100
METRIC RATING
2nd/ 347
METRIC RANK
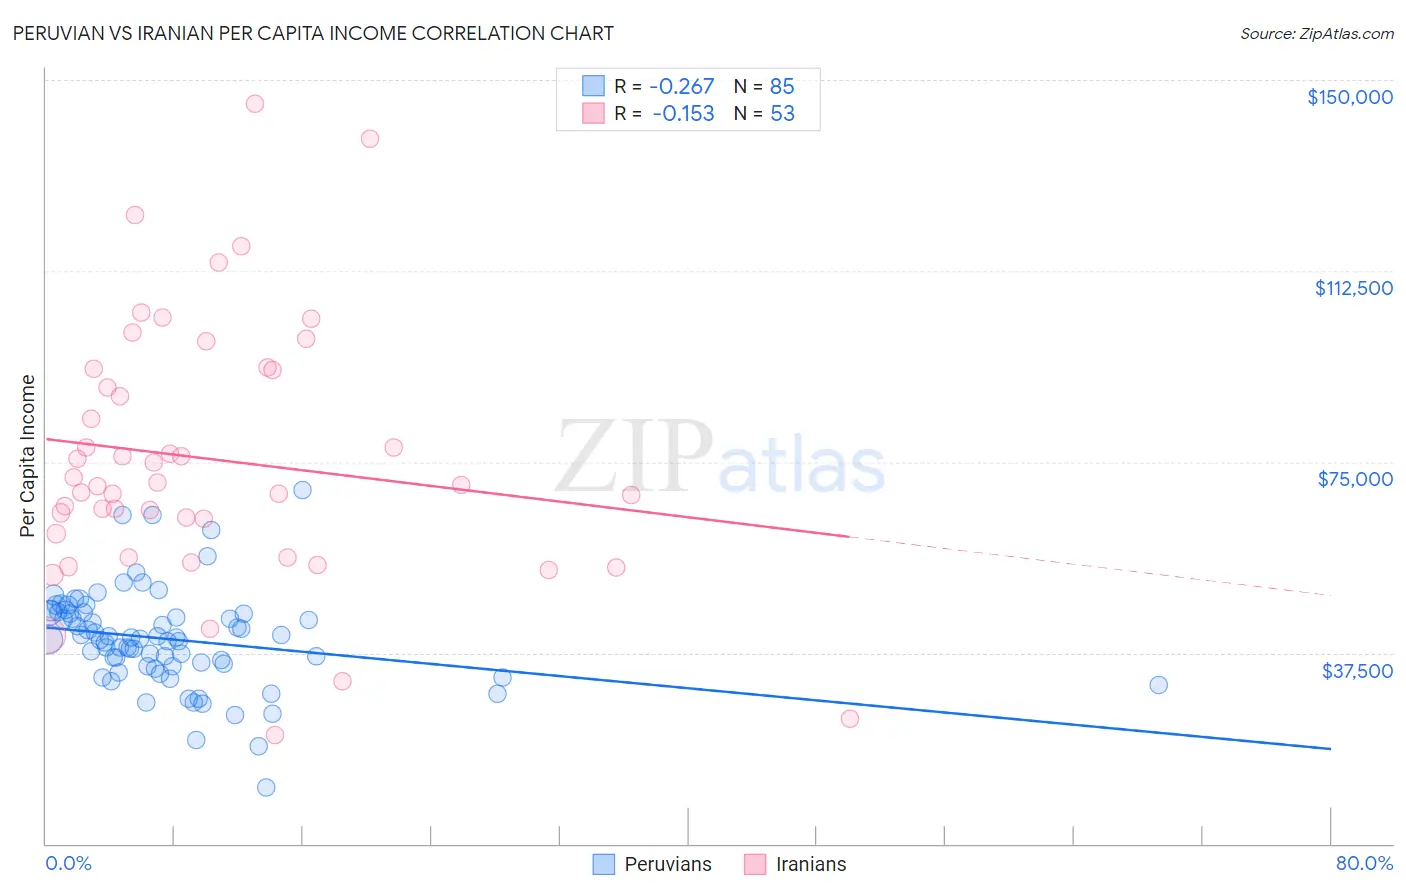
Peruvian vs Iranian Per Capita Income Correlation Chart
The statistical analysis conducted on geographies consisting of 363,263,285 people shows a weak negative correlation between the proportion of Peruvians and per capita income in the United States with a correlation coefficient (R) of -0.267 and weighted average of $44,479. Similarly, the statistical analysis conducted on geographies consisting of 316,916,136 people shows a poor negative correlation between the proportion of Iranians and per capita income in the United States with a correlation coefficient (R) of -0.153 and weighted average of $58,786, a difference of 32.2%.
Per Capita Income Correlation Summary
| Measurement | Peruvian | Iranian |
| Minimum | $11,041 | $21,346 |
| Maximum | $69,376 | $145,312 |
| Range | $58,335 | $123,966 |
| Mean | $40,176 | $75,439 |
| Median | $40,253 | $70,507 |
| Interquartile 25% (IQ1) | $34,775 | $58,523 |
| Interquartile 75% (IQ3) | $45,381 | $93,126 |
| Interquartile Range (IQR) | $10,606 | $34,604 |
| Standard Deviation (Sample) | $9,639 | $25,681 |
| Standard Deviation (Population) | $9,582 | $25,438 |
Similar Demographics by Per Capita Income
Demographics Similar to Peruvians by Per Capita Income
In terms of per capita income, the demographic groups most similar to Peruvians are Norwegian ($44,480, a difference of 0.0%), Immigrants from Eritrea ($44,509, a difference of 0.070%), Scottish ($44,440, a difference of 0.090%), Korean ($44,522, a difference of 0.10%), and Immigrants from Armenia ($44,552, a difference of 0.17%).
| Demographics | Rating | Rank | Per Capita Income |
| Immigrants | Afghanistan | 78.0 /100 | #145 | Good $44,790 |
| Irish | 75.8 /100 | #146 | Good $44,679 |
| Czechs | 74.1 /100 | #147 | Good $44,595 |
| Immigrants | Armenia | 73.1 /100 | #148 | Good $44,552 |
| Koreans | 72.5 /100 | #149 | Good $44,522 |
| Immigrants | Eritrea | 72.1 /100 | #150 | Good $44,509 |
| Norwegians | 71.5 /100 | #151 | Good $44,480 |
| Peruvians | 71.5 /100 | #152 | Good $44,479 |
| Scottish | 70.6 /100 | #153 | Good $44,440 |
| Portuguese | 68.7 /100 | #154 | Good $44,362 |
| Uruguayans | 67.6 /100 | #155 | Good $44,318 |
| Slovaks | 65.4 /100 | #156 | Good $44,229 |
| South American Indians | 64.8 /100 | #157 | Good $44,206 |
| Immigrants | Nepal | 64.3 /100 | #158 | Good $44,187 |
| South Americans | 62.4 /100 | #159 | Good $44,114 |
Demographics Similar to Iranians by Per Capita Income
In terms of per capita income, the demographic groups most similar to Iranians are Filipino ($59,066, a difference of 0.48%), Immigrants from Singapore ($58,353, a difference of 0.74%), Immigrants from Australia ($57,953, a difference of 1.4%), Immigrants from Iran ($57,759, a difference of 1.8%), and Immigrants from Taiwan ($57,742, a difference of 1.8%).
| Demographics | Rating | Rank | Per Capita Income |
| Filipinos | 100.0 /100 | #1 | Exceptional $59,066 |
| Iranians | 100.0 /100 | #2 | Exceptional $58,786 |
| Immigrants | Singapore | 100.0 /100 | #3 | Exceptional $58,353 |
| Immigrants | Australia | 100.0 /100 | #4 | Exceptional $57,953 |
| Immigrants | Iran | 100.0 /100 | #5 | Exceptional $57,759 |
| Immigrants | Taiwan | 100.0 /100 | #6 | Exceptional $57,742 |
| Immigrants | Israel | 100.0 /100 | #7 | Exceptional $57,384 |
| Immigrants | Hong Kong | 100.0 /100 | #8 | Exceptional $56,709 |
| Immigrants | Ireland | 100.0 /100 | #9 | Exceptional $56,584 |
| Okinawans | 100.0 /100 | #10 | Exceptional $55,817 |
| Eastern Europeans | 100.0 /100 | #11 | Exceptional $55,780 |
| Immigrants | Sweden | 100.0 /100 | #12 | Exceptional $55,582 |
| Immigrants | India | 100.0 /100 | #13 | Exceptional $55,268 |
| Immigrants | Belgium | 100.0 /100 | #14 | Exceptional $55,082 |
| Cypriots | 100.0 /100 | #15 | Exceptional $54,899 |