Mongolian vs Iranian Per Capita Income
COMPARE
Mongolian
Iranian
Per Capita Income
Per Capita Income Comparison
Mongolians
Iranians
$49,173
PER CAPITA INCOME
99.8/ 100
METRIC RATING
74th/ 347
METRIC RANK
$58,786
PER CAPITA INCOME
100.0/ 100
METRIC RATING
2nd/ 347
METRIC RANK
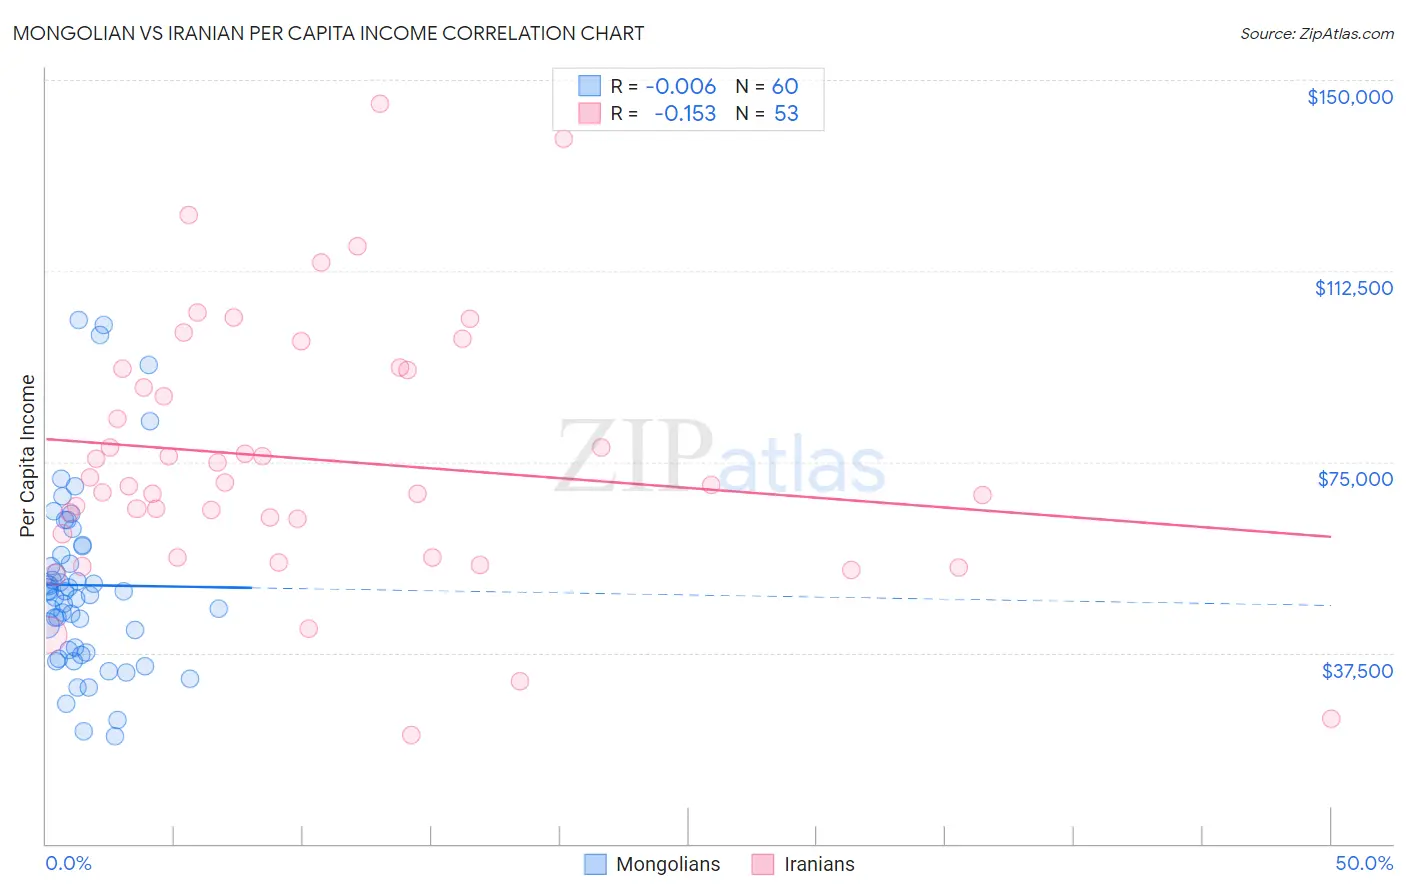
Mongolian vs Iranian Per Capita Income Correlation Chart
The statistical analysis conducted on geographies consisting of 140,356,705 people shows no correlation between the proportion of Mongolians and per capita income in the United States with a correlation coefficient (R) of -0.006 and weighted average of $49,173. Similarly, the statistical analysis conducted on geographies consisting of 316,916,136 people shows a poor negative correlation between the proportion of Iranians and per capita income in the United States with a correlation coefficient (R) of -0.153 and weighted average of $58,786, a difference of 19.6%.
Per Capita Income Correlation Summary
| Measurement | Mongolian | Iranian |
| Minimum | $21,025 | $21,346 |
| Maximum | $102,845 | $145,312 |
| Range | $81,820 | $123,966 |
| Mean | $50,803 | $75,439 |
| Median | $49,216 | $70,507 |
| Interquartile 25% (IQ1) | $37,778 | $58,523 |
| Interquartile 75% (IQ3) | $57,579 | $93,126 |
| Interquartile Range (IQR) | $19,802 | $34,604 |
| Standard Deviation (Sample) | $18,159 | $25,681 |
| Standard Deviation (Population) | $18,007 | $25,438 |
Similar Demographics by Per Capita Income
Demographics Similar to Mongolians by Per Capita Income
In terms of per capita income, the demographic groups most similar to Mongolians are Immigrants from Hungary ($49,303, a difference of 0.26%), Immigrants from North America ($49,302, a difference of 0.26%), Greek ($49,309, a difference of 0.28%), Immigrants from Eastern Europe ($49,316, a difference of 0.29%), and Immigrants from Bolivia ($48,970, a difference of 0.41%).
| Demographics | Rating | Rank | Per Capita Income |
| Immigrants | Romania | 99.9 /100 | #67 | Exceptional $49,463 |
| Lithuanians | 99.8 /100 | #68 | Exceptional $49,448 |
| Immigrants | Canada | 99.8 /100 | #69 | Exceptional $49,412 |
| Immigrants | Eastern Europe | 99.8 /100 | #70 | Exceptional $49,316 |
| Greeks | 99.8 /100 | #71 | Exceptional $49,309 |
| Immigrants | Hungary | 99.8 /100 | #72 | Exceptional $49,303 |
| Immigrants | North America | 99.8 /100 | #73 | Exceptional $49,302 |
| Mongolians | 99.8 /100 | #74 | Exceptional $49,173 |
| Immigrants | Bolivia | 99.7 /100 | #75 | Exceptional $48,970 |
| Immigrants | England | 99.7 /100 | #76 | Exceptional $48,844 |
| Immigrants | Kazakhstan | 99.7 /100 | #77 | Exceptional $48,747 |
| Immigrants | Italy | 99.6 /100 | #78 | Exceptional $48,654 |
| Romanians | 99.5 /100 | #79 | Exceptional $48,445 |
| Egyptians | 99.5 /100 | #80 | Exceptional $48,358 |
| Armenians | 99.4 /100 | #81 | Exceptional $48,287 |
Demographics Similar to Iranians by Per Capita Income
In terms of per capita income, the demographic groups most similar to Iranians are Filipino ($59,066, a difference of 0.48%), Immigrants from Singapore ($58,353, a difference of 0.74%), Immigrants from Australia ($57,953, a difference of 1.4%), Immigrants from Iran ($57,759, a difference of 1.8%), and Immigrants from Taiwan ($57,742, a difference of 1.8%).
| Demographics | Rating | Rank | Per Capita Income |
| Filipinos | 100.0 /100 | #1 | Exceptional $59,066 |
| Iranians | 100.0 /100 | #2 | Exceptional $58,786 |
| Immigrants | Singapore | 100.0 /100 | #3 | Exceptional $58,353 |
| Immigrants | Australia | 100.0 /100 | #4 | Exceptional $57,953 |
| Immigrants | Iran | 100.0 /100 | #5 | Exceptional $57,759 |
| Immigrants | Taiwan | 100.0 /100 | #6 | Exceptional $57,742 |
| Immigrants | Israel | 100.0 /100 | #7 | Exceptional $57,384 |
| Immigrants | Hong Kong | 100.0 /100 | #8 | Exceptional $56,709 |
| Immigrants | Ireland | 100.0 /100 | #9 | Exceptional $56,584 |
| Okinawans | 100.0 /100 | #10 | Exceptional $55,817 |
| Eastern Europeans | 100.0 /100 | #11 | Exceptional $55,780 |
| Immigrants | Sweden | 100.0 /100 | #12 | Exceptional $55,582 |
| Immigrants | India | 100.0 /100 | #13 | Exceptional $55,268 |
| Immigrants | Belgium | 100.0 /100 | #14 | Exceptional $55,082 |
| Cypriots | 100.0 /100 | #15 | Exceptional $54,899 |