Basque vs Spanish American Per Capita Income
COMPARE
Basque
Spanish American
Per Capita Income
Per Capita Income Comparison
Basques
Spanish Americans
$45,086
PER CAPITA INCOME
83.2/ 100
METRIC RATING
139th/ 347
METRIC RANK
$39,012
PER CAPITA INCOME
0.5/ 100
METRIC RATING
265th/ 347
METRIC RANK
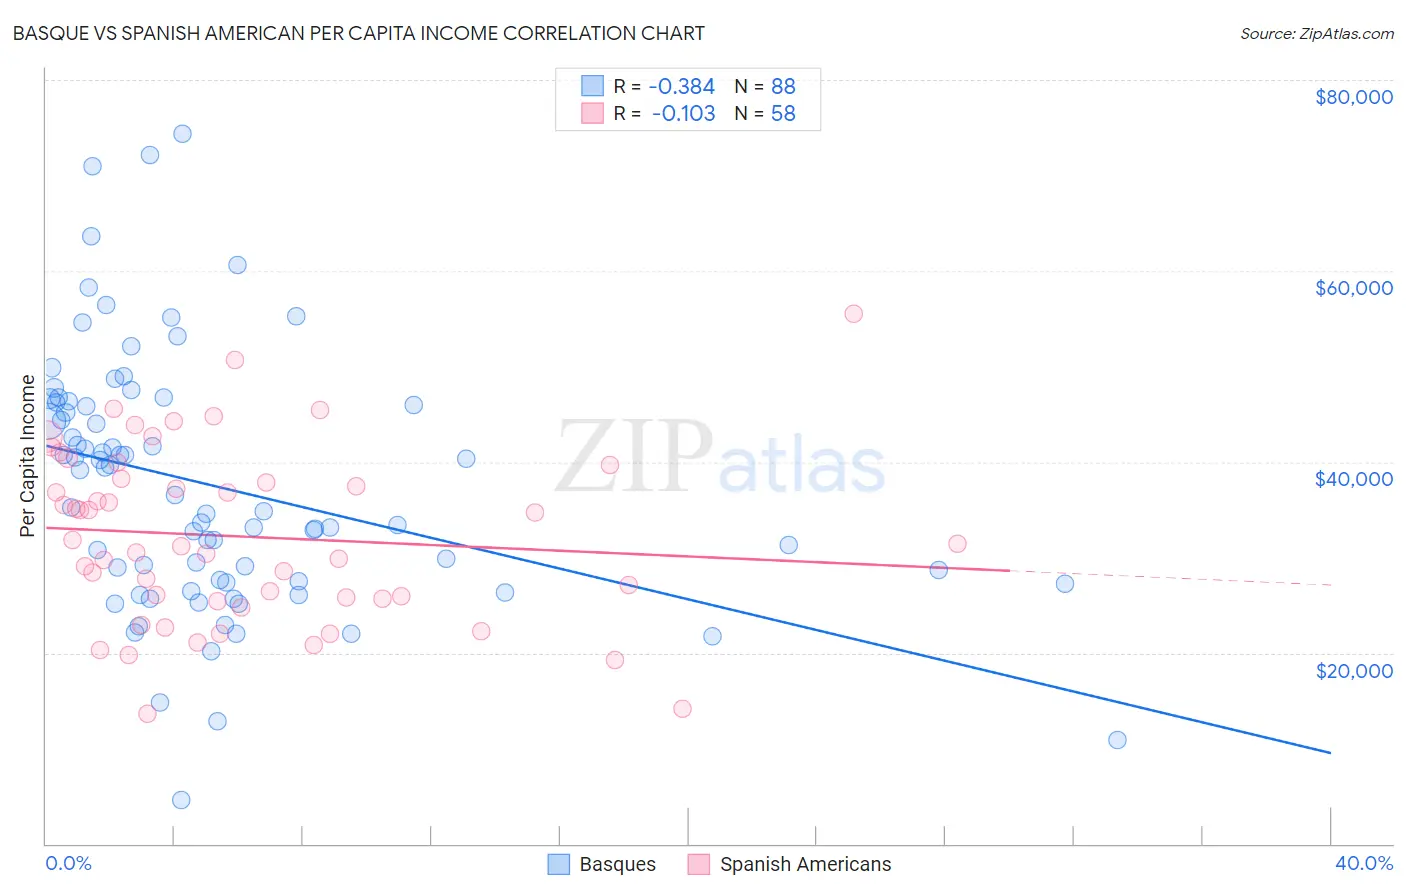
Basque vs Spanish American Per Capita Income Correlation Chart
The statistical analysis conducted on geographies consisting of 165,779,827 people shows a mild negative correlation between the proportion of Basques and per capita income in the United States with a correlation coefficient (R) of -0.384 and weighted average of $45,086. Similarly, the statistical analysis conducted on geographies consisting of 103,168,021 people shows a poor negative correlation between the proportion of Spanish Americans and per capita income in the United States with a correlation coefficient (R) of -0.103 and weighted average of $39,012, a difference of 15.6%.
Per Capita Income Correlation Summary
| Measurement | Basque | Spanish American |
| Minimum | $4,617 | $13,649 |
| Maximum | $74,412 | $55,562 |
| Range | $69,795 | $41,913 |
| Mean | $37,448 | $32,169 |
| Median | $35,882 | $31,264 |
| Interquartile 25% (IQ1) | $27,463 | $25,700 |
| Interquartile 75% (IQ3) | $46,112 | $38,250 |
| Interquartile Range (IQR) | $18,649 | $12,550 |
| Standard Deviation (Sample) | $13,380 | $9,124 |
| Standard Deviation (Population) | $13,304 | $9,045 |
Similar Demographics by Per Capita Income
Demographics Similar to Basques by Per Capita Income
In terms of per capita income, the demographic groups most similar to Basques are Immigrants from Jordan ($45,066, a difference of 0.050%), Slavic ($45,049, a difference of 0.080%), Ugandan ($45,047, a difference of 0.090%), Immigrants from Uganda ($45,043, a difference of 0.10%), and Icelander ($44,987, a difference of 0.22%).
| Demographics | Rating | Rank | Per Capita Income |
| Jordanians | 89.9 /100 | #132 | Excellent $45,605 |
| Pakistanis | 89.7 /100 | #133 | Excellent $45,587 |
| Slovenes | 89.6 /100 | #134 | Excellent $45,581 |
| Hungarians | 87.9 /100 | #135 | Excellent $45,426 |
| Immigrants | Oceania | 85.2 /100 | #136 | Excellent $45,220 |
| Immigrants | Syria | 85.2 /100 | #137 | Excellent $45,218 |
| Assyrians/Chaldeans/Syriacs | 84.8 /100 | #138 | Excellent $45,195 |
| Basques | 83.2 /100 | #139 | Excellent $45,086 |
| Immigrants | Jordan | 82.9 /100 | #140 | Excellent $45,066 |
| Slavs | 82.6 /100 | #141 | Excellent $45,049 |
| Ugandans | 82.6 /100 | #142 | Excellent $45,047 |
| Immigrants | Uganda | 82.5 /100 | #143 | Excellent $45,043 |
| Icelanders | 81.6 /100 | #144 | Excellent $44,987 |
| Immigrants | Afghanistan | 78.0 /100 | #145 | Good $44,790 |
| Irish | 75.8 /100 | #146 | Good $44,679 |
Demographics Similar to Spanish Americans by Per Capita Income
In terms of per capita income, the demographic groups most similar to Spanish Americans are American ($39,039, a difference of 0.070%), Belizean ($39,097, a difference of 0.22%), Iroquois ($39,104, a difference of 0.23%), Marshallese ($39,108, a difference of 0.25%), and Alaskan Athabascan ($39,163, a difference of 0.39%).
| Demographics | Rating | Rank | Per Capita Income |
| Jamaicans | 0.7 /100 | #258 | Tragic $39,231 |
| Malaysians | 0.7 /100 | #259 | Tragic $39,194 |
| Alaskan Athabascans | 0.6 /100 | #260 | Tragic $39,163 |
| Marshallese | 0.6 /100 | #261 | Tragic $39,108 |
| Iroquois | 0.6 /100 | #262 | Tragic $39,104 |
| Belizeans | 0.6 /100 | #263 | Tragic $39,097 |
| Americans | 0.6 /100 | #264 | Tragic $39,039 |
| Spanish Americans | 0.5 /100 | #265 | Tragic $39,012 |
| Salvadorans | 0.5 /100 | #266 | Tragic $38,858 |
| Immigrants | Zaire | 0.4 /100 | #267 | Tragic $38,848 |
| Liberians | 0.4 /100 | #268 | Tragic $38,780 |
| Immigrants | Jamaica | 0.4 /100 | #269 | Tragic $38,766 |
| Immigrants | Belize | 0.3 /100 | #270 | Tragic $38,614 |
| Central Americans | 0.3 /100 | #271 | Tragic $38,560 |
| Immigrants | Cabo Verde | 0.3 /100 | #272 | Tragic $38,540 |