Immigrants from Uzbekistan vs Iranian Per Capita Income
COMPARE
Immigrants from Uzbekistan
Iranian
Per Capita Income
Per Capita Income Comparison
Immigrants from Uzbekistan
Iranians
$46,929
PER CAPITA INCOME
97.5/ 100
METRIC RATING
101st/ 347
METRIC RANK
$58,786
PER CAPITA INCOME
100.0/ 100
METRIC RATING
2nd/ 347
METRIC RANK
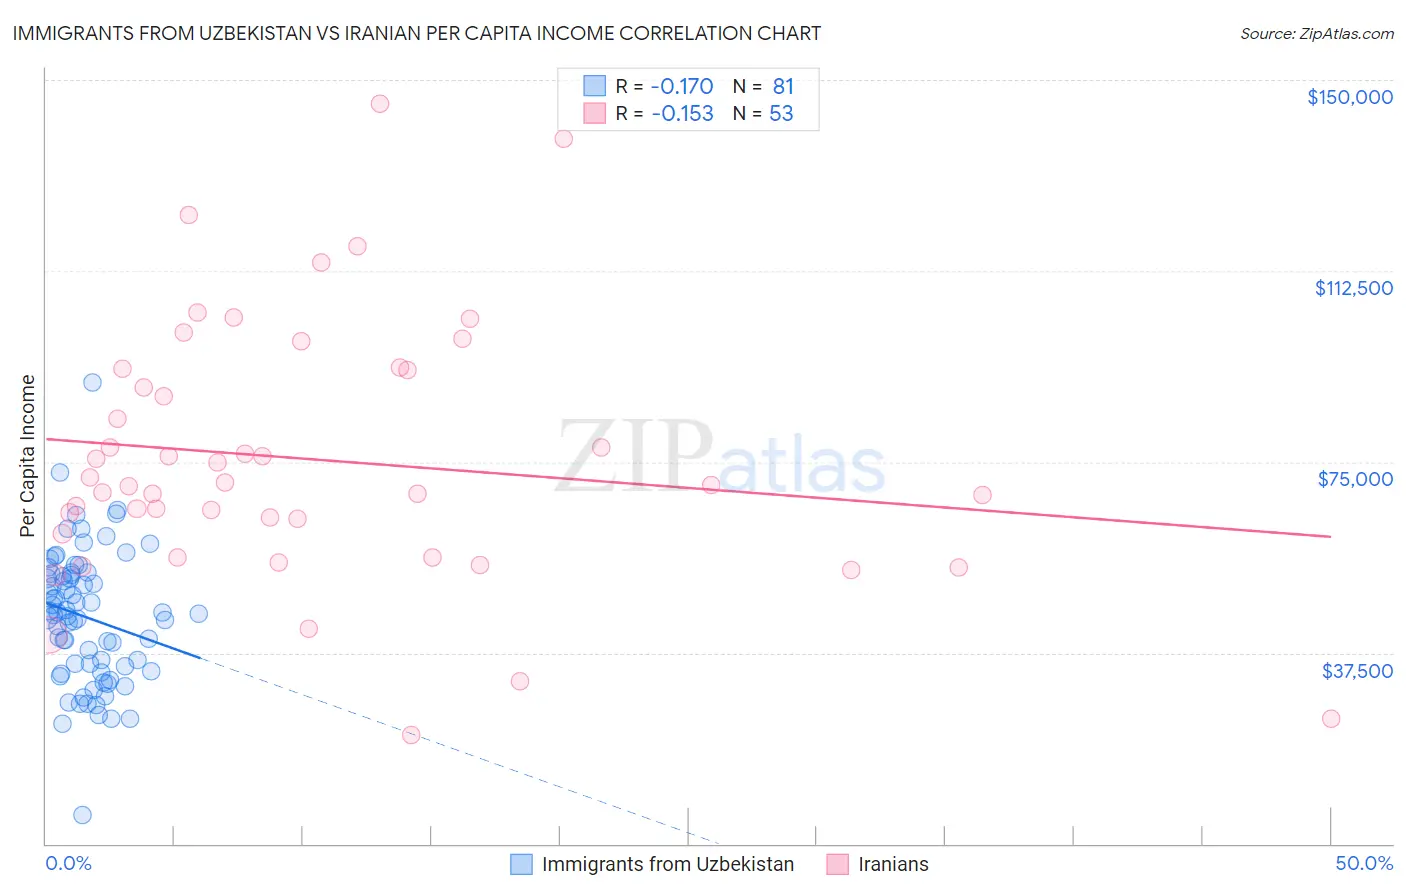
Immigrants from Uzbekistan vs Iranian Per Capita Income Correlation Chart
The statistical analysis conducted on geographies consisting of 118,766,454 people shows a poor negative correlation between the proportion of Immigrants from Uzbekistan and per capita income in the United States with a correlation coefficient (R) of -0.170 and weighted average of $46,929. Similarly, the statistical analysis conducted on geographies consisting of 316,916,136 people shows a poor negative correlation between the proportion of Iranians and per capita income in the United States with a correlation coefficient (R) of -0.153 and weighted average of $58,786, a difference of 25.3%.
Per Capita Income Correlation Summary
| Measurement | Immigrants from Uzbekistan | Iranian |
| Minimum | $5,747 | $21,346 |
| Maximum | $90,679 | $145,312 |
| Range | $84,932 | $123,966 |
| Mean | $44,513 | $75,439 |
| Median | $45,080 | $70,507 |
| Interquartile 25% (IQ1) | $34,402 | $58,523 |
| Interquartile 75% (IQ3) | $52,838 | $93,126 |
| Interquartile Range (IQR) | $18,436 | $34,604 |
| Standard Deviation (Sample) | $13,145 | $25,681 |
| Standard Deviation (Population) | $13,064 | $25,438 |
Similar Demographics by Per Capita Income
Demographics Similar to Immigrants from Uzbekistan by Per Capita Income
In terms of per capita income, the demographic groups most similar to Immigrants from Uzbekistan are Immigrants from Lebanon ($46,938, a difference of 0.020%), Immigrants from Western Asia ($46,876, a difference of 0.11%), Syrian ($46,837, a difference of 0.20%), Laotian ($47,041, a difference of 0.24%), and Immigrants from Pakistan ($47,084, a difference of 0.33%).
| Demographics | Rating | Rank | Per Capita Income |
| Albanians | 98.5 /100 | #94 | Exceptional $47,379 |
| Immigrants | Egypt | 98.5 /100 | #95 | Exceptional $47,361 |
| Alsatians | 98.3 /100 | #96 | Exceptional $47,284 |
| Carpatho Rusyns | 98.2 /100 | #97 | Exceptional $47,248 |
| Immigrants | Pakistan | 97.9 /100 | #98 | Exceptional $47,084 |
| Laotians | 97.8 /100 | #99 | Exceptional $47,041 |
| Immigrants | Lebanon | 97.5 /100 | #100 | Exceptional $46,938 |
| Immigrants | Uzbekistan | 97.5 /100 | #101 | Exceptional $46,929 |
| Immigrants | Western Asia | 97.4 /100 | #102 | Exceptional $46,876 |
| Syrians | 97.2 /100 | #103 | Exceptional $46,837 |
| Brazilians | 96.8 /100 | #104 | Exceptional $46,700 |
| British | 96.3 /100 | #105 | Exceptional $46,571 |
| Ethiopians | 96.3 /100 | #106 | Exceptional $46,569 |
| Serbians | 96.2 /100 | #107 | Exceptional $46,551 |
| Immigrants | Kuwait | 96.2 /100 | #108 | Exceptional $46,543 |
Demographics Similar to Iranians by Per Capita Income
In terms of per capita income, the demographic groups most similar to Iranians are Filipino ($59,066, a difference of 0.48%), Immigrants from Singapore ($58,353, a difference of 0.74%), Immigrants from Australia ($57,953, a difference of 1.4%), Immigrants from Iran ($57,759, a difference of 1.8%), and Immigrants from Taiwan ($57,742, a difference of 1.8%).
| Demographics | Rating | Rank | Per Capita Income |
| Filipinos | 100.0 /100 | #1 | Exceptional $59,066 |
| Iranians | 100.0 /100 | #2 | Exceptional $58,786 |
| Immigrants | Singapore | 100.0 /100 | #3 | Exceptional $58,353 |
| Immigrants | Australia | 100.0 /100 | #4 | Exceptional $57,953 |
| Immigrants | Iran | 100.0 /100 | #5 | Exceptional $57,759 |
| Immigrants | Taiwan | 100.0 /100 | #6 | Exceptional $57,742 |
| Immigrants | Israel | 100.0 /100 | #7 | Exceptional $57,384 |
| Immigrants | Hong Kong | 100.0 /100 | #8 | Exceptional $56,709 |
| Immigrants | Ireland | 100.0 /100 | #9 | Exceptional $56,584 |
| Okinawans | 100.0 /100 | #10 | Exceptional $55,817 |
| Eastern Europeans | 100.0 /100 | #11 | Exceptional $55,780 |
| Immigrants | Sweden | 100.0 /100 | #12 | Exceptional $55,582 |
| Immigrants | India | 100.0 /100 | #13 | Exceptional $55,268 |
| Immigrants | Belgium | 100.0 /100 | #14 | Exceptional $55,082 |
| Cypriots | 100.0 /100 | #15 | Exceptional $54,899 |