Bangladeshi vs Immigrants from Indonesia Median Household Income
COMPARE
Bangladeshi
Immigrants from Indonesia
Median Household Income
Median Household Income Comparison
Bangladeshis
Immigrants from Indonesia
$74,112
MEDIAN HOUSEHOLD INCOME
0.1/ 100
METRIC RATING
290th/ 347
METRIC RANK
$97,297
MEDIAN HOUSEHOLD INCOME
100.0/ 100
METRIC RATING
38th/ 347
METRIC RANK
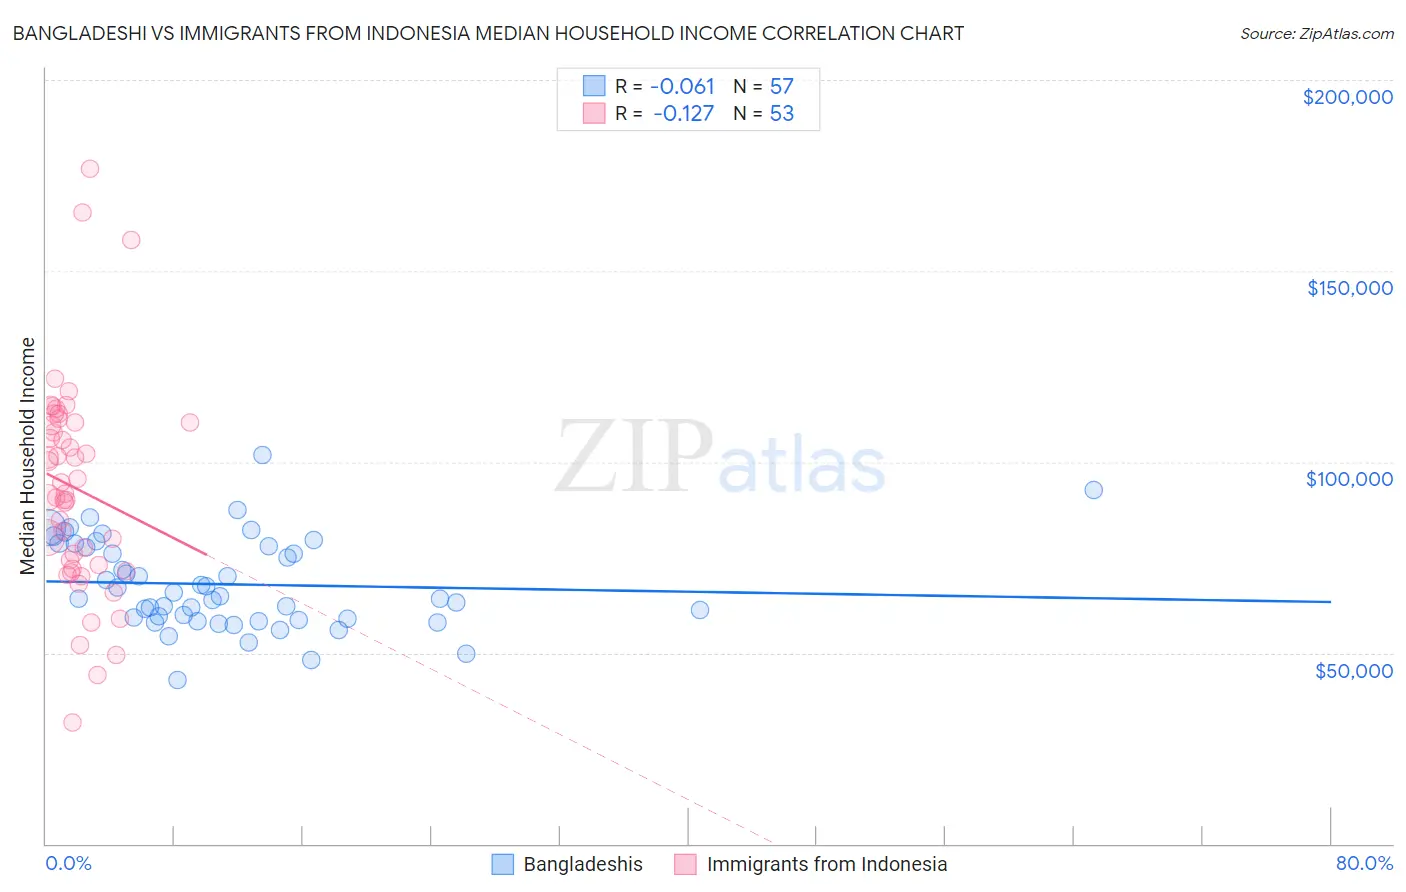
Bangladeshi vs Immigrants from Indonesia Median Household Income Correlation Chart
The statistical analysis conducted on geographies consisting of 141,320,446 people shows a slight negative correlation between the proportion of Bangladeshis and median household income in the United States with a correlation coefficient (R) of -0.061 and weighted average of $74,112. Similarly, the statistical analysis conducted on geographies consisting of 215,679,873 people shows a poor negative correlation between the proportion of Immigrants from Indonesia and median household income in the United States with a correlation coefficient (R) of -0.127 and weighted average of $97,297, a difference of 31.3%.
Median Household Income Correlation Summary
| Measurement | Bangladeshi | Immigrants from Indonesia |
| Minimum | $42,858 | $31,861 |
| Maximum | $101,820 | $176,702 |
| Range | $58,962 | $144,840 |
| Mean | $67,935 | $93,146 |
| Median | $64,799 | $91,574 |
| Interquartile 25% (IQ1) | $58,792 | $72,477 |
| Interquartile 75% (IQ3) | $78,284 | $110,341 |
| Interquartile Range (IQR) | $19,492 | $37,864 |
| Standard Deviation (Sample) | $11,839 | $27,918 |
| Standard Deviation (Population) | $11,735 | $27,654 |
Similar Demographics by Median Household Income
Demographics Similar to Bangladeshis by Median Household Income
In terms of median household income, the demographic groups most similar to Bangladeshis are Fijian ($74,205, a difference of 0.13%), Immigrants from Central America ($74,217, a difference of 0.14%), Iroquois ($74,279, a difference of 0.23%), Immigrants from Somalia ($74,300, a difference of 0.25%), and Mexican ($74,399, a difference of 0.39%).
| Demographics | Rating | Rank | Median Household Income |
| Cree | 0.1 /100 | #283 | Tragic $74,685 |
| Yaqui | 0.1 /100 | #284 | Tragic $74,596 |
| Mexicans | 0.1 /100 | #285 | Tragic $74,399 |
| Immigrants | Somalia | 0.1 /100 | #286 | Tragic $74,300 |
| Iroquois | 0.1 /100 | #287 | Tragic $74,279 |
| Immigrants | Central America | 0.1 /100 | #288 | Tragic $74,217 |
| Fijians | 0.1 /100 | #289 | Tragic $74,205 |
| Bangladeshis | 0.1 /100 | #290 | Tragic $74,112 |
| Hispanics or Latinos | 0.1 /100 | #291 | Tragic $73,823 |
| Comanche | 0.1 /100 | #292 | Tragic $73,747 |
| Immigrants | Cabo Verde | 0.1 /100 | #293 | Tragic $73,515 |
| Blackfeet | 0.1 /100 | #294 | Tragic $73,509 |
| Cubans | 0.1 /100 | #295 | Tragic $73,392 |
| Haitians | 0.1 /100 | #296 | Tragic $73,306 |
| Immigrants | Mexico | 0.0 /100 | #297 | Tragic $73,160 |
Demographics Similar to Immigrants from Indonesia by Median Household Income
In terms of median household income, the demographic groups most similar to Immigrants from Indonesia are Latvian ($97,311, a difference of 0.010%), Immigrants from Pakistan ($97,528, a difference of 0.24%), Afghan ($97,026, a difference of 0.28%), Maltese ($97,015, a difference of 0.29%), and Immigrants from Turkey ($96,964, a difference of 0.34%).
| Demographics | Rating | Rank | Median Household Income |
| Turks | 100.0 /100 | #31 | Exceptional $99,389 |
| Immigrants | Denmark | 100.0 /100 | #32 | Exceptional $98,510 |
| Chinese | 100.0 /100 | #33 | Exceptional $98,496 |
| Russians | 100.0 /100 | #34 | Exceptional $98,008 |
| Immigrants | Switzerland | 100.0 /100 | #35 | Exceptional $97,979 |
| Immigrants | Pakistan | 100.0 /100 | #36 | Exceptional $97,528 |
| Latvians | 100.0 /100 | #37 | Exceptional $97,311 |
| Immigrants | Indonesia | 100.0 /100 | #38 | Exceptional $97,297 |
| Afghans | 100.0 /100 | #39 | Exceptional $97,026 |
| Maltese | 100.0 /100 | #40 | Exceptional $97,015 |
| Immigrants | Turkey | 100.0 /100 | #41 | Exceptional $96,964 |
| Immigrants | Lithuania | 99.9 /100 | #42 | Exceptional $96,836 |
| Immigrants | France | 99.9 /100 | #43 | Exceptional $96,743 |
| Immigrants | Greece | 99.9 /100 | #44 | Exceptional $96,675 |
| Israelis | 99.9 /100 | #45 | Exceptional $96,552 |