Bangladeshi vs Immigrants from Oceania Median Household Income
COMPARE
Bangladeshi
Immigrants from Oceania
Median Household Income
Median Household Income Comparison
Bangladeshis
Immigrants from Oceania
$74,112
MEDIAN HOUSEHOLD INCOME
0.1/ 100
METRIC RATING
290th/ 347
METRIC RANK
$89,100
MEDIAN HOUSEHOLD INCOME
92.9/ 100
METRIC RATING
126th/ 347
METRIC RANK
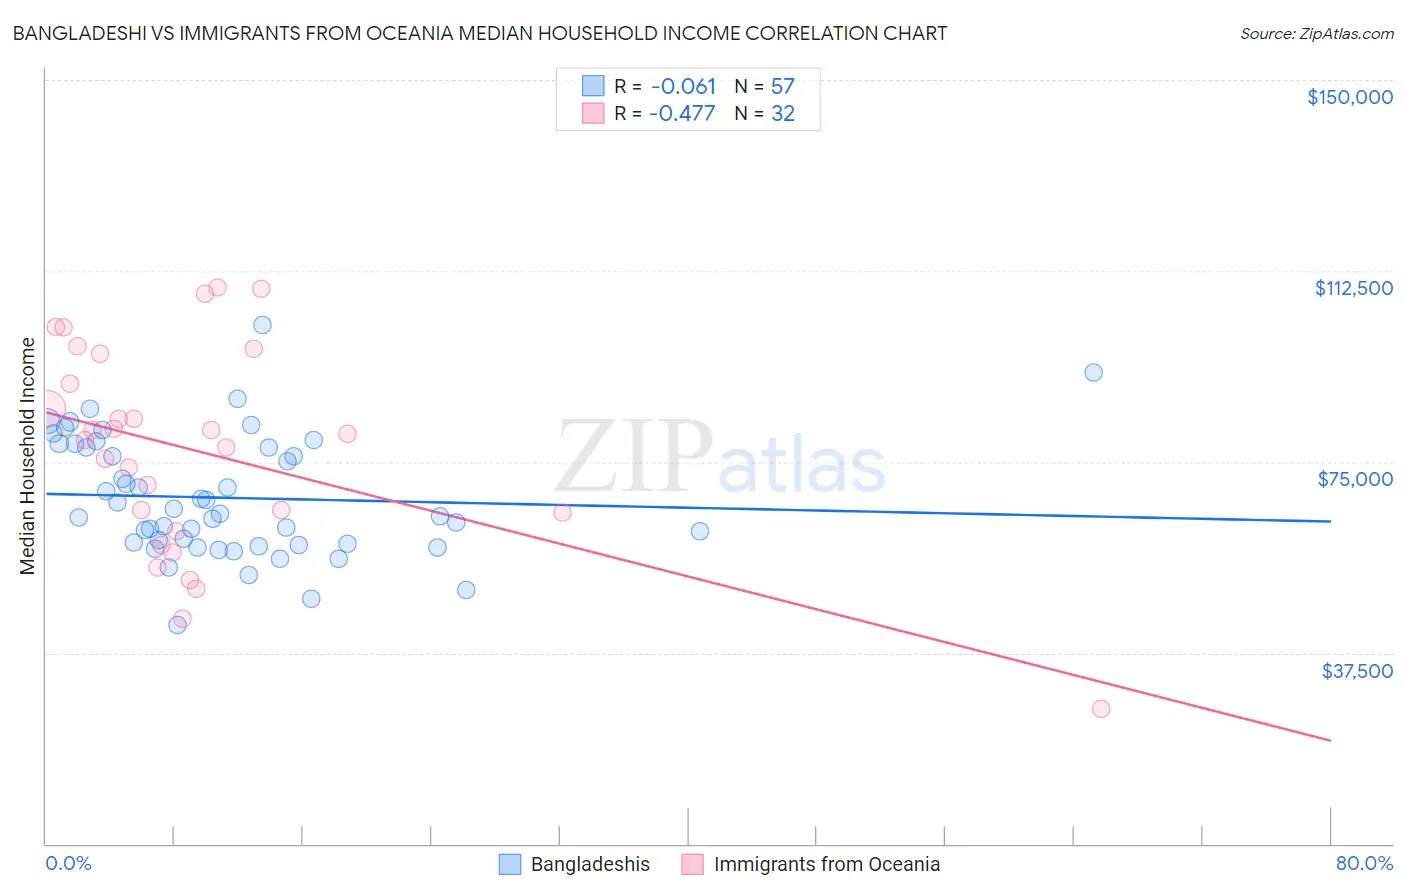
Bangladeshi vs Immigrants from Oceania Median Household Income Correlation Chart
The statistical analysis conducted on geographies consisting of 141,320,446 people shows a slight negative correlation between the proportion of Bangladeshis and median household income in the United States with a correlation coefficient (R) of -0.061 and weighted average of $74,112. Similarly, the statistical analysis conducted on geographies consisting of 305,340,910 people shows a moderate negative correlation between the proportion of Immigrants from Oceania and median household income in the United States with a correlation coefficient (R) of -0.477 and weighted average of $89,100, a difference of 20.2%.
Median Household Income Correlation Summary
| Measurement | Bangladeshi | Immigrants from Oceania |
| Minimum | $42,858 | $26,558 |
| Maximum | $101,820 | $109,241 |
| Range | $58,962 | $82,683 |
| Mean | $67,935 | $77,019 |
| Median | $64,799 | $80,011 |
| Interquartile 25% (IQ1) | $58,792 | $63,155 |
| Interquartile 75% (IQ3) | $78,284 | $93,329 |
| Interquartile Range (IQR) | $19,492 | $30,174 |
| Standard Deviation (Sample) | $11,839 | $20,295 |
| Standard Deviation (Population) | $11,735 | $19,975 |
Similar Demographics by Median Household Income
Demographics Similar to Bangladeshis by Median Household Income
In terms of median household income, the demographic groups most similar to Bangladeshis are Fijian ($74,205, a difference of 0.13%), Immigrants from Central America ($74,217, a difference of 0.14%), Iroquois ($74,279, a difference of 0.23%), Immigrants from Somalia ($74,300, a difference of 0.25%), and Mexican ($74,399, a difference of 0.39%).
| Demographics | Rating | Rank | Median Household Income |
| Cree | 0.1 /100 | #283 | Tragic $74,685 |
| Yaqui | 0.1 /100 | #284 | Tragic $74,596 |
| Mexicans | 0.1 /100 | #285 | Tragic $74,399 |
| Immigrants | Somalia | 0.1 /100 | #286 | Tragic $74,300 |
| Iroquois | 0.1 /100 | #287 | Tragic $74,279 |
| Immigrants | Central America | 0.1 /100 | #288 | Tragic $74,217 |
| Fijians | 0.1 /100 | #289 | Tragic $74,205 |
| Bangladeshis | 0.1 /100 | #290 | Tragic $74,112 |
| Hispanics or Latinos | 0.1 /100 | #291 | Tragic $73,823 |
| Comanche | 0.1 /100 | #292 | Tragic $73,747 |
| Immigrants | Cabo Verde | 0.1 /100 | #293 | Tragic $73,515 |
| Blackfeet | 0.1 /100 | #294 | Tragic $73,509 |
| Cubans | 0.1 /100 | #295 | Tragic $73,392 |
| Haitians | 0.1 /100 | #296 | Tragic $73,306 |
| Immigrants | Mexico | 0.0 /100 | #297 | Tragic $73,160 |
Demographics Similar to Immigrants from Oceania by Median Household Income
In terms of median household income, the demographic groups most similar to Immigrants from Oceania are Immigrants from Peru ($89,010, a difference of 0.10%), Portuguese ($88,976, a difference of 0.14%), Immigrants from Kuwait ($89,263, a difference of 0.18%), Brazilian ($88,934, a difference of 0.19%), and British ($88,914, a difference of 0.21%).
| Demographics | Rating | Rank | Median Household Income |
| Albanians | 95.2 /100 | #119 | Exceptional $89,744 |
| Immigrants | North Macedonia | 95.2 /100 | #120 | Exceptional $89,741 |
| Ethiopians | 94.9 /100 | #121 | Exceptional $89,640 |
| Pakistanis | 94.8 /100 | #122 | Exceptional $89,638 |
| Immigrants | Zimbabwe | 94.4 /100 | #123 | Exceptional $89,496 |
| Immigrants | Jordan | 94.1 /100 | #124 | Exceptional $89,412 |
| Immigrants | Kuwait | 93.5 /100 | #125 | Exceptional $89,263 |
| Immigrants | Oceania | 92.9 /100 | #126 | Exceptional $89,100 |
| Immigrants | Peru | 92.5 /100 | #127 | Exceptional $89,010 |
| Portuguese | 92.3 /100 | #128 | Exceptional $88,976 |
| Brazilians | 92.1 /100 | #129 | Exceptional $88,934 |
| British | 92.0 /100 | #130 | Exceptional $88,914 |
| Immigrants | Syria | 91.4 /100 | #131 | Exceptional $88,792 |
| Europeans | 91.2 /100 | #132 | Exceptional $88,751 |
| Immigrants | Ethiopia | 90.9 /100 | #133 | Exceptional $88,687 |