Bangladeshi vs Alsatian Median Household Income
COMPARE
Bangladeshi
Alsatian
Median Household Income
Median Household Income Comparison
Bangladeshis
Alsatians
$74,112
MEDIAN HOUSEHOLD INCOME
0.1/ 100
METRIC RATING
290th/ 347
METRIC RANK
$85,053
MEDIAN HOUSEHOLD INCOME
49.2/ 100
METRIC RATING
176th/ 347
METRIC RANK
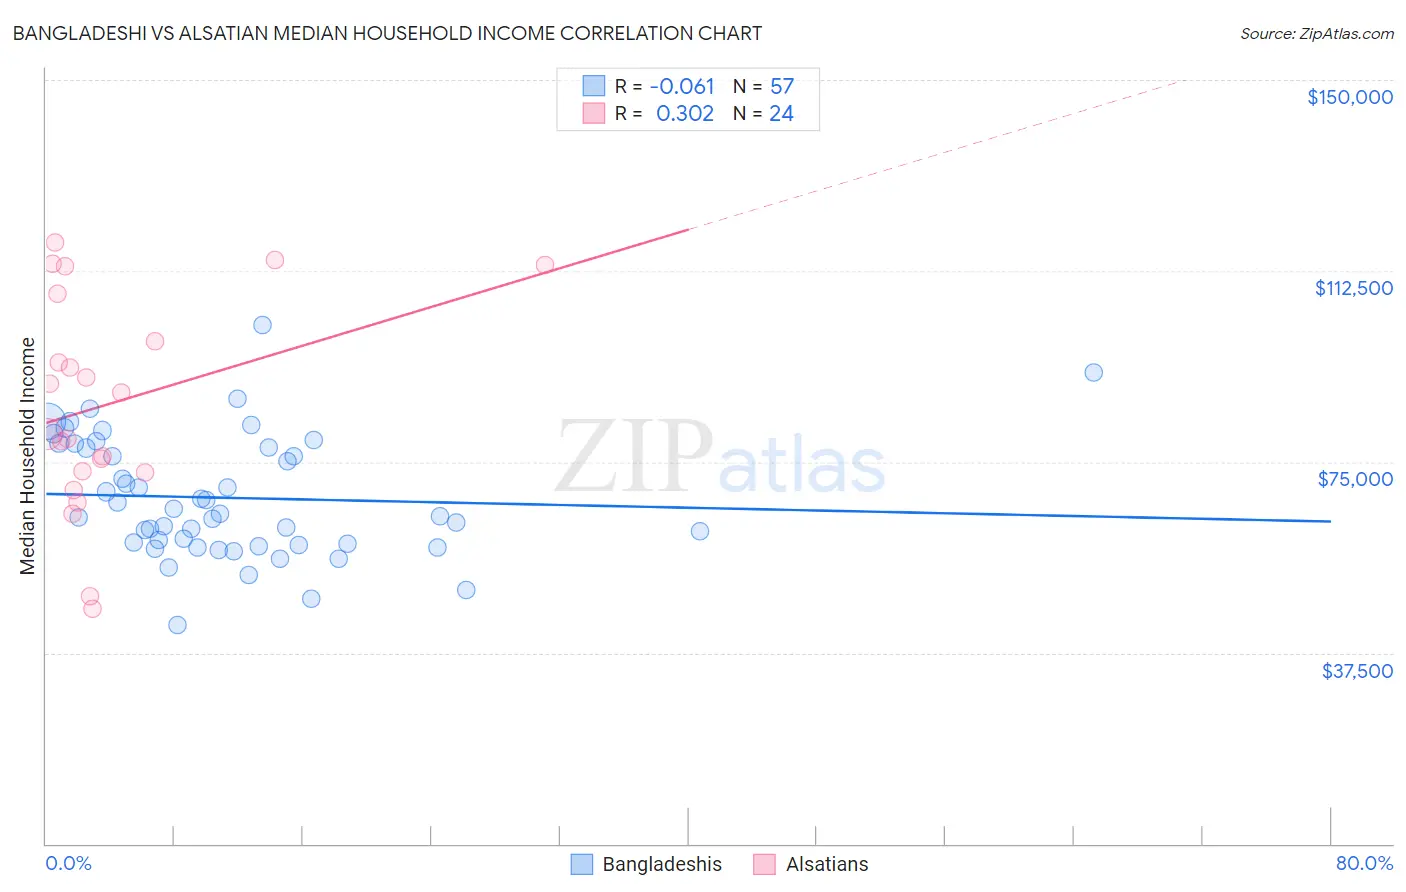
Bangladeshi vs Alsatian Median Household Income Correlation Chart
The statistical analysis conducted on geographies consisting of 141,320,446 people shows a slight negative correlation between the proportion of Bangladeshis and median household income in the United States with a correlation coefficient (R) of -0.061 and weighted average of $74,112. Similarly, the statistical analysis conducted on geographies consisting of 82,678,631 people shows a mild positive correlation between the proportion of Alsatians and median household income in the United States with a correlation coefficient (R) of 0.302 and weighted average of $85,053, a difference of 14.8%.
Median Household Income Correlation Summary
| Measurement | Bangladeshi | Alsatian |
| Minimum | $42,858 | $46,250 |
| Maximum | $101,820 | $118,135 |
| Range | $58,962 | $71,885 |
| Mean | $67,935 | $86,339 |
| Median | $64,799 | $84,486 |
| Interquartile 25% (IQ1) | $58,792 | $73,000 |
| Interquartile 75% (IQ3) | $78,284 | $103,435 |
| Interquartile Range (IQR) | $19,492 | $30,436 |
| Standard Deviation (Sample) | $11,839 | $20,538 |
| Standard Deviation (Population) | $11,735 | $20,105 |
Similar Demographics by Median Household Income
Demographics Similar to Bangladeshis by Median Household Income
In terms of median household income, the demographic groups most similar to Bangladeshis are Fijian ($74,205, a difference of 0.13%), Immigrants from Central America ($74,217, a difference of 0.14%), Iroquois ($74,279, a difference of 0.23%), Immigrants from Somalia ($74,300, a difference of 0.25%), and Mexican ($74,399, a difference of 0.39%).
| Demographics | Rating | Rank | Median Household Income |
| Cree | 0.1 /100 | #283 | Tragic $74,685 |
| Yaqui | 0.1 /100 | #284 | Tragic $74,596 |
| Mexicans | 0.1 /100 | #285 | Tragic $74,399 |
| Immigrants | Somalia | 0.1 /100 | #286 | Tragic $74,300 |
| Iroquois | 0.1 /100 | #287 | Tragic $74,279 |
| Immigrants | Central America | 0.1 /100 | #288 | Tragic $74,217 |
| Fijians | 0.1 /100 | #289 | Tragic $74,205 |
| Bangladeshis | 0.1 /100 | #290 | Tragic $74,112 |
| Hispanics or Latinos | 0.1 /100 | #291 | Tragic $73,823 |
| Comanche | 0.1 /100 | #292 | Tragic $73,747 |
| Immigrants | Cabo Verde | 0.1 /100 | #293 | Tragic $73,515 |
| Blackfeet | 0.1 /100 | #294 | Tragic $73,509 |
| Cubans | 0.1 /100 | #295 | Tragic $73,392 |
| Haitians | 0.1 /100 | #296 | Tragic $73,306 |
| Immigrants | Mexico | 0.0 /100 | #297 | Tragic $73,160 |
Demographics Similar to Alsatians by Median Household Income
In terms of median household income, the demographic groups most similar to Alsatians are Immigrants from Costa Rica ($85,054, a difference of 0.0%), Immigrants from Eritrea ($85,025, a difference of 0.030%), Scottish ($85,101, a difference of 0.060%), Czechoslovakian ($84,965, a difference of 0.10%), and English ($84,915, a difference of 0.16%).
| Demographics | Rating | Rank | Median Household Income |
| Colombians | 59.7 /100 | #169 | Average $85,716 |
| Swiss | 59.2 /100 | #170 | Average $85,681 |
| Immigrants | South America | 58.1 /100 | #171 | Average $85,611 |
| Slovenes | 57.4 /100 | #172 | Average $85,562 |
| Immigrants | Cameroon | 53.4 /100 | #173 | Average $85,314 |
| Scottish | 50.0 /100 | #174 | Average $85,101 |
| Immigrants | Costa Rica | 49.2 /100 | #175 | Average $85,054 |
| Alsatians | 49.2 /100 | #176 | Average $85,053 |
| Immigrants | Eritrea | 48.8 /100 | #177 | Average $85,025 |
| Czechoslovakians | 47.8 /100 | #178 | Average $84,965 |
| English | 47.0 /100 | #179 | Average $84,915 |
| Immigrants | Portugal | 44.2 /100 | #180 | Average $84,740 |
| Hawaiians | 44.1 /100 | #181 | Average $84,729 |
| Uruguayans | 43.5 /100 | #182 | Average $84,691 |
| Spaniards | 42.7 /100 | #183 | Average $84,644 |