Bangladeshi vs Immigrants from Spain Median Household Income
COMPARE
Bangladeshi
Immigrants from Spain
Median Household Income
Median Household Income Comparison
Bangladeshis
Immigrants from Spain
$74,112
MEDIAN HOUSEHOLD INCOME
0.1/ 100
METRIC RATING
290th/ 347
METRIC RANK
$92,732
MEDIAN HOUSEHOLD INCOME
99.3/ 100
METRIC RATING
82nd/ 347
METRIC RANK
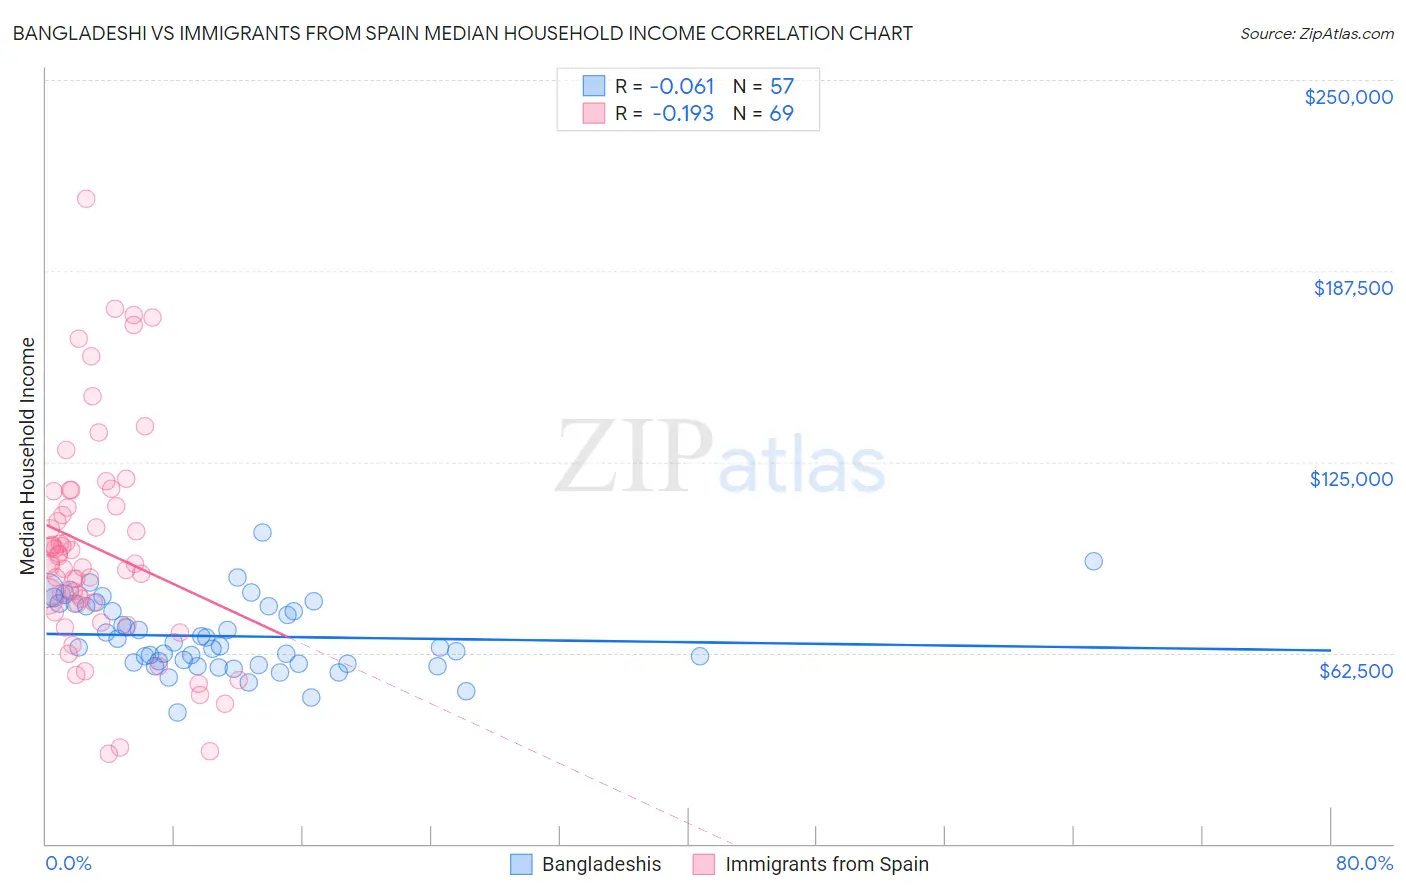
Bangladeshi vs Immigrants from Spain Median Household Income Correlation Chart
The statistical analysis conducted on geographies consisting of 141,320,446 people shows a slight negative correlation between the proportion of Bangladeshis and median household income in the United States with a correlation coefficient (R) of -0.061 and weighted average of $74,112. Similarly, the statistical analysis conducted on geographies consisting of 239,554,501 people shows a poor negative correlation between the proportion of Immigrants from Spain and median household income in the United States with a correlation coefficient (R) of -0.193 and weighted average of $92,732, a difference of 25.1%.
Median Household Income Correlation Summary
| Measurement | Bangladeshi | Immigrants from Spain |
| Minimum | $42,858 | $29,291 |
| Maximum | $101,820 | $211,250 |
| Range | $58,962 | $181,959 |
| Mean | $67,935 | $96,765 |
| Median | $64,799 | $92,124 |
| Interquartile 25% (IQ1) | $58,792 | $77,194 |
| Interquartile 75% (IQ3) | $78,284 | $112,999 |
| Interquartile Range (IQR) | $19,492 | $35,805 |
| Standard Deviation (Sample) | $11,839 | $36,186 |
| Standard Deviation (Population) | $11,735 | $35,922 |
Similar Demographics by Median Household Income
Demographics Similar to Bangladeshis by Median Household Income
In terms of median household income, the demographic groups most similar to Bangladeshis are Fijian ($74,205, a difference of 0.13%), Immigrants from Central America ($74,217, a difference of 0.14%), Iroquois ($74,279, a difference of 0.23%), Immigrants from Somalia ($74,300, a difference of 0.25%), and Mexican ($74,399, a difference of 0.39%).
| Demographics | Rating | Rank | Median Household Income |
| Cree | 0.1 /100 | #283 | Tragic $74,685 |
| Yaqui | 0.1 /100 | #284 | Tragic $74,596 |
| Mexicans | 0.1 /100 | #285 | Tragic $74,399 |
| Immigrants | Somalia | 0.1 /100 | #286 | Tragic $74,300 |
| Iroquois | 0.1 /100 | #287 | Tragic $74,279 |
| Immigrants | Central America | 0.1 /100 | #288 | Tragic $74,217 |
| Fijians | 0.1 /100 | #289 | Tragic $74,205 |
| Bangladeshis | 0.1 /100 | #290 | Tragic $74,112 |
| Hispanics or Latinos | 0.1 /100 | #291 | Tragic $73,823 |
| Comanche | 0.1 /100 | #292 | Tragic $73,747 |
| Immigrants | Cabo Verde | 0.1 /100 | #293 | Tragic $73,515 |
| Blackfeet | 0.1 /100 | #294 | Tragic $73,509 |
| Cubans | 0.1 /100 | #295 | Tragic $73,392 |
| Haitians | 0.1 /100 | #296 | Tragic $73,306 |
| Immigrants | Mexico | 0.0 /100 | #297 | Tragic $73,160 |
Demographics Similar to Immigrants from Spain by Median Household Income
In terms of median household income, the demographic groups most similar to Immigrants from Spain are Italian ($92,475, a difference of 0.28%), Immigrants from Eastern Europe ($93,051, a difference of 0.34%), Immigrants from Argentina ($92,417, a difference of 0.34%), Tongan ($93,076, a difference of 0.37%), and Sri Lankan ($93,093, a difference of 0.39%).
| Demographics | Rating | Rank | Median Household Income |
| Immigrants | Italy | 99.5 /100 | #75 | Exceptional $93,465 |
| South Africans | 99.5 /100 | #76 | Exceptional $93,379 |
| Immigrants | Afghanistan | 99.5 /100 | #77 | Exceptional $93,375 |
| Immigrants | Bulgaria | 99.4 /100 | #78 | Exceptional $93,148 |
| Sri Lankans | 99.4 /100 | #79 | Exceptional $93,093 |
| Tongans | 99.4 /100 | #80 | Exceptional $93,076 |
| Immigrants | Eastern Europe | 99.4 /100 | #81 | Exceptional $93,051 |
| Immigrants | Spain | 99.3 /100 | #82 | Exceptional $92,732 |
| Italians | 99.1 /100 | #83 | Exceptional $92,475 |
| Immigrants | Argentina | 99.1 /100 | #84 | Exceptional $92,417 |
| Immigrants | Croatia | 99.0 /100 | #85 | Exceptional $92,225 |
| Immigrants | England | 98.9 /100 | #86 | Exceptional $92,098 |
| Immigrants | Hungary | 98.9 /100 | #87 | Exceptional $92,094 |
| Immigrants | Canada | 98.8 /100 | #88 | Exceptional $92,029 |
| Romanians | 98.8 /100 | #89 | Exceptional $91,994 |