Bangladeshi vs Estonian Median Household Income
COMPARE
Bangladeshi
Estonian
Median Household Income
Median Household Income Comparison
Bangladeshis
Estonians
$74,112
MEDIAN HOUSEHOLD INCOME
0.1/ 100
METRIC RATING
290th/ 347
METRIC RANK
$95,930
MEDIAN HOUSEHOLD INCOME
99.9/ 100
METRIC RATING
51st/ 347
METRIC RANK
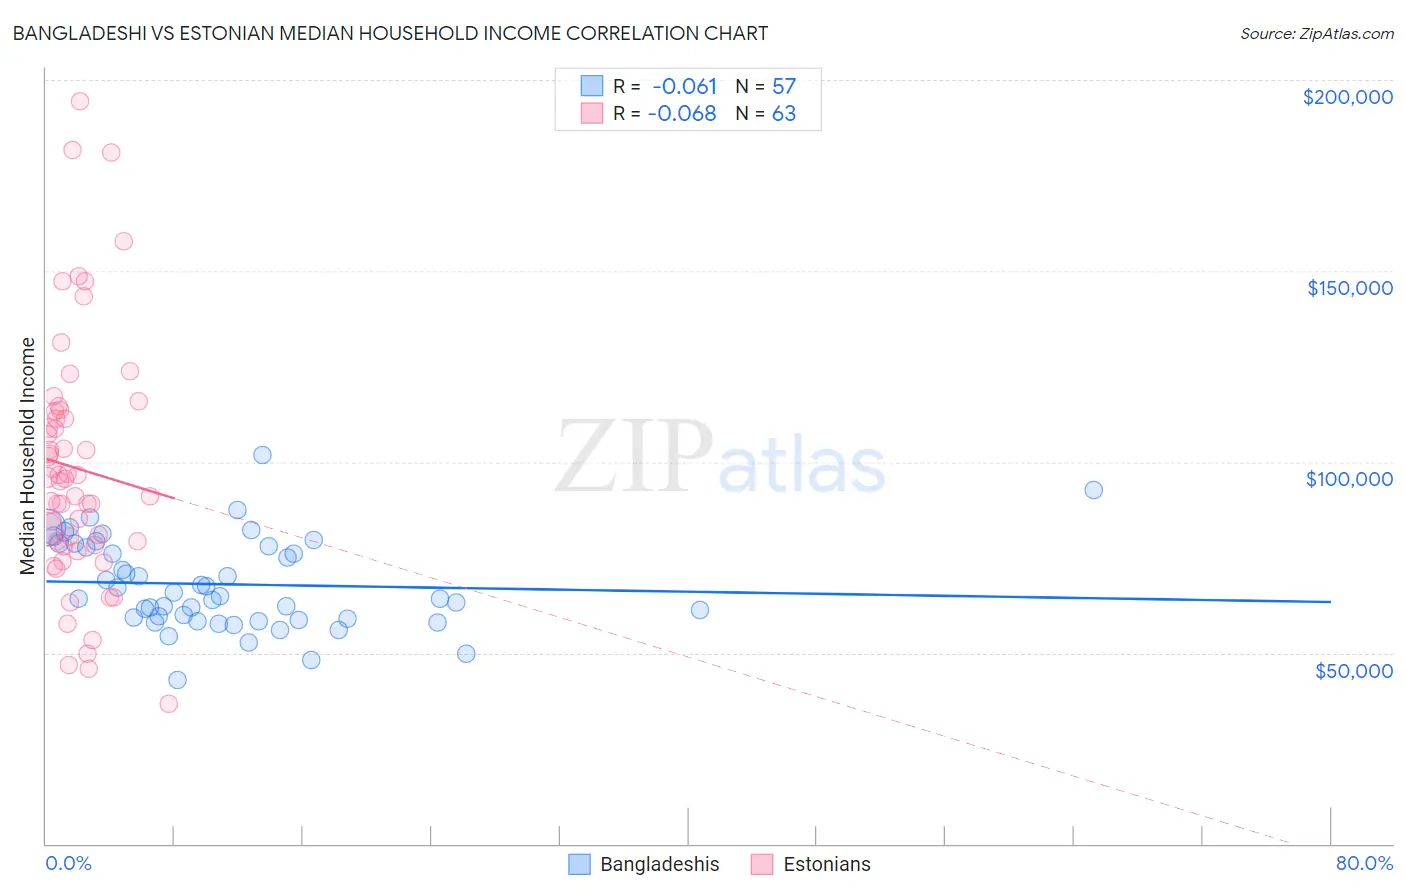
Bangladeshi vs Estonian Median Household Income Correlation Chart
The statistical analysis conducted on geographies consisting of 141,320,446 people shows a slight negative correlation between the proportion of Bangladeshis and median household income in the United States with a correlation coefficient (R) of -0.061 and weighted average of $74,112. Similarly, the statistical analysis conducted on geographies consisting of 123,471,102 people shows a slight negative correlation between the proportion of Estonians and median household income in the United States with a correlation coefficient (R) of -0.068 and weighted average of $95,930, a difference of 29.4%.
Median Household Income Correlation Summary
| Measurement | Bangladeshi | Estonian |
| Minimum | $42,858 | $36,563 |
| Maximum | $101,820 | $194,375 |
| Range | $58,962 | $157,812 |
| Mean | $67,935 | $98,343 |
| Median | $64,799 | $95,522 |
| Interquartile 25% (IQ1) | $58,792 | $78,091 |
| Interquartile 75% (IQ3) | $78,284 | $113,403 |
| Interquartile Range (IQR) | $19,492 | $35,312 |
| Standard Deviation (Sample) | $11,839 | $32,504 |
| Standard Deviation (Population) | $11,735 | $32,245 |
Similar Demographics by Median Household Income
Demographics Similar to Bangladeshis by Median Household Income
In terms of median household income, the demographic groups most similar to Bangladeshis are Fijian ($74,205, a difference of 0.13%), Immigrants from Central America ($74,217, a difference of 0.14%), Iroquois ($74,279, a difference of 0.23%), Immigrants from Somalia ($74,300, a difference of 0.25%), and Mexican ($74,399, a difference of 0.39%).
| Demographics | Rating | Rank | Median Household Income |
| Cree | 0.1 /100 | #283 | Tragic $74,685 |
| Yaqui | 0.1 /100 | #284 | Tragic $74,596 |
| Mexicans | 0.1 /100 | #285 | Tragic $74,399 |
| Immigrants | Somalia | 0.1 /100 | #286 | Tragic $74,300 |
| Iroquois | 0.1 /100 | #287 | Tragic $74,279 |
| Immigrants | Central America | 0.1 /100 | #288 | Tragic $74,217 |
| Fijians | 0.1 /100 | #289 | Tragic $74,205 |
| Bangladeshis | 0.1 /100 | #290 | Tragic $74,112 |
| Hispanics or Latinos | 0.1 /100 | #291 | Tragic $73,823 |
| Comanche | 0.1 /100 | #292 | Tragic $73,747 |
| Immigrants | Cabo Verde | 0.1 /100 | #293 | Tragic $73,515 |
| Blackfeet | 0.1 /100 | #294 | Tragic $73,509 |
| Cubans | 0.1 /100 | #295 | Tragic $73,392 |
| Haitians | 0.1 /100 | #296 | Tragic $73,306 |
| Immigrants | Mexico | 0.0 /100 | #297 | Tragic $73,160 |
Demographics Similar to Estonians by Median Household Income
In terms of median household income, the demographic groups most similar to Estonians are Immigrants from South Africa ($95,800, a difference of 0.14%), Paraguayan ($95,737, a difference of 0.20%), Egyptian ($95,673, a difference of 0.27%), Immigrants from Malaysia ($96,292, a difference of 0.38%), and Bulgarian ($96,290, a difference of 0.38%).
| Demographics | Rating | Rank | Median Household Income |
| Immigrants | Greece | 99.9 /100 | #44 | Exceptional $96,675 |
| Israelis | 99.9 /100 | #45 | Exceptional $96,552 |
| Australians | 99.9 /100 | #46 | Exceptional $96,490 |
| Immigrants | Russia | 99.9 /100 | #47 | Exceptional $96,378 |
| Cambodians | 99.9 /100 | #48 | Exceptional $96,324 |
| Immigrants | Malaysia | 99.9 /100 | #49 | Exceptional $96,292 |
| Bulgarians | 99.9 /100 | #50 | Exceptional $96,290 |
| Estonians | 99.9 /100 | #51 | Exceptional $95,930 |
| Immigrants | South Africa | 99.9 /100 | #52 | Exceptional $95,800 |
| Paraguayans | 99.9 /100 | #53 | Exceptional $95,737 |
| Egyptians | 99.9 /100 | #54 | Exceptional $95,673 |
| Immigrants | Czechoslovakia | 99.9 /100 | #55 | Exceptional $95,319 |
| Immigrants | Austria | 99.9 /100 | #56 | Exceptional $95,277 |
| New Zealanders | 99.8 /100 | #57 | Exceptional $95,146 |
| Soviet Union | 99.8 /100 | #58 | Exceptional $95,098 |