Bangladeshi vs Immigrants from Belgium Median Male Earnings
COMPARE
Bangladeshi
Immigrants from Belgium
Median Male Earnings
Median Male Earnings Comparison
Bangladeshis
Immigrants from Belgium
$46,744
MEDIAN MALE EARNINGS
0.1/ 100
METRIC RATING
304th/ 347
METRIC RANK
$66,125
MEDIAN MALE EARNINGS
100.0/ 100
METRIC RATING
17th/ 347
METRIC RANK
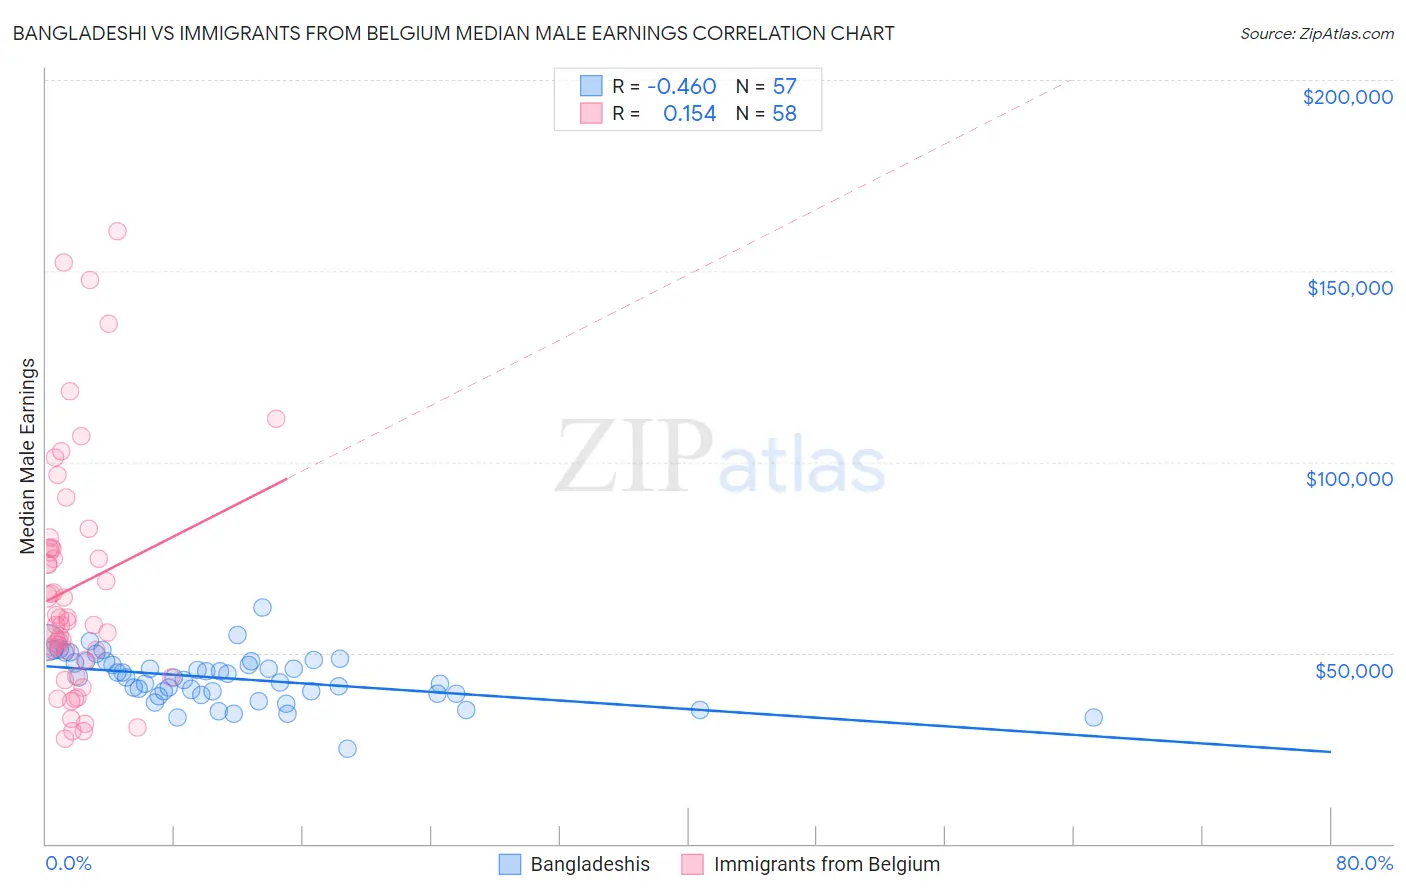
Bangladeshi vs Immigrants from Belgium Median Male Earnings Correlation Chart
The statistical analysis conducted on geographies consisting of 141,442,222 people shows a moderate negative correlation between the proportion of Bangladeshis and median male earnings in the United States with a correlation coefficient (R) of -0.460 and weighted average of $46,744. Similarly, the statistical analysis conducted on geographies consisting of 146,683,317 people shows a poor positive correlation between the proportion of Immigrants from Belgium and median male earnings in the United States with a correlation coefficient (R) of 0.154 and weighted average of $66,125, a difference of 41.5%.
Median Male Earnings Correlation Summary
| Measurement | Bangladeshi | Immigrants from Belgium |
| Minimum | $24,888 | $27,540 |
| Maximum | $61,776 | $160,536 |
| Range | $36,888 | $132,996 |
| Mean | $43,307 | $67,352 |
| Median | $43,611 | $58,812 |
| Interquartile 25% (IQ1) | $39,220 | $48,036 |
| Interquartile 75% (IQ3) | $47,786 | $77,202 |
| Interquartile Range (IQR) | $8,565 | $29,166 |
| Standard Deviation (Sample) | $6,481 | $31,129 |
| Standard Deviation (Population) | $6,424 | $30,859 |
Similar Demographics by Median Male Earnings
Demographics Similar to Bangladeshis by Median Male Earnings
In terms of median male earnings, the demographic groups most similar to Bangladeshis are Guatemalan ($46,736, a difference of 0.020%), Yaqui ($46,777, a difference of 0.070%), Seminole ($46,783, a difference of 0.080%), Dutch West Indian ($46,656, a difference of 0.19%), and Immigrants from Dominican Republic ($46,655, a difference of 0.19%).
| Demographics | Rating | Rank | Median Male Earnings |
| Dominicans | 0.1 /100 | #297 | Tragic $47,204 |
| Immigrants | Micronesia | 0.1 /100 | #298 | Tragic $47,177 |
| Immigrants | Zaire | 0.1 /100 | #299 | Tragic $47,070 |
| U.S. Virgin Islanders | 0.1 /100 | #300 | Tragic $47,066 |
| Immigrants | Latin America | 0.1 /100 | #301 | Tragic $46,941 |
| Seminole | 0.1 /100 | #302 | Tragic $46,783 |
| Yaqui | 0.1 /100 | #303 | Tragic $46,777 |
| Bangladeshis | 0.1 /100 | #304 | Tragic $46,744 |
| Guatemalans | 0.0 /100 | #305 | Tragic $46,736 |
| Dutch West Indians | 0.0 /100 | #306 | Tragic $46,656 |
| Immigrants | Dominican Republic | 0.0 /100 | #307 | Tragic $46,655 |
| Ottawa | 0.0 /100 | #308 | Tragic $46,611 |
| Creek | 0.0 /100 | #309 | Tragic $46,594 |
| Cubans | 0.0 /100 | #310 | Tragic $46,580 |
| Apache | 0.0 /100 | #311 | Tragic $46,429 |
Demographics Similar to Immigrants from Belgium by Median Male Earnings
In terms of median male earnings, the demographic groups most similar to Immigrants from Belgium are Indian (Asian) ($66,078, a difference of 0.070%), Eastern European ($66,472, a difference of 0.53%), Cypriot ($65,549, a difference of 0.88%), Immigrants from Japan ($65,518, a difference of 0.93%), and Immigrants from Sweden ($65,406, a difference of 1.1%).
| Demographics | Rating | Rank | Median Male Earnings |
| Immigrants | Israel | 100.0 /100 | #10 | Exceptional $68,716 |
| Immigrants | Ireland | 100.0 /100 | #11 | Exceptional $67,698 |
| Immigrants | Australia | 100.0 /100 | #12 | Exceptional $67,634 |
| Immigrants | China | 100.0 /100 | #13 | Exceptional $67,353 |
| Okinawans | 100.0 /100 | #14 | Exceptional $67,232 |
| Immigrants | Eastern Asia | 100.0 /100 | #15 | Exceptional $66,903 |
| Eastern Europeans | 100.0 /100 | #16 | Exceptional $66,472 |
| Immigrants | Belgium | 100.0 /100 | #17 | Exceptional $66,125 |
| Indians (Asian) | 100.0 /100 | #18 | Exceptional $66,078 |
| Cypriots | 100.0 /100 | #19 | Exceptional $65,549 |
| Immigrants | Japan | 100.0 /100 | #20 | Exceptional $65,518 |
| Immigrants | Sweden | 100.0 /100 | #21 | Exceptional $65,406 |
| Burmese | 100.0 /100 | #22 | Exceptional $65,236 |
| Immigrants | Korea | 100.0 /100 | #23 | Exceptional $65,079 |
| Immigrants | Northern Europe | 100.0 /100 | #24 | Exceptional $64,987 |