Bangladeshi vs Immigrants from Jamaica Householder Income Ages 45 - 64 years
COMPARE
Bangladeshi
Immigrants from Jamaica
Householder Income Ages 45 - 64 years
Householder Income Ages 45 - 64 years Comparison
Bangladeshis
Immigrants from Jamaica
$86,402
HOUSEHOLDER INCOME AGES 45 - 64 YEARS
0.1/ 100
METRIC RATING
287th/ 347
METRIC RANK
$87,035
HOUSEHOLDER INCOME AGES 45 - 64 YEARS
0.1/ 100
METRIC RATING
278th/ 347
METRIC RANK
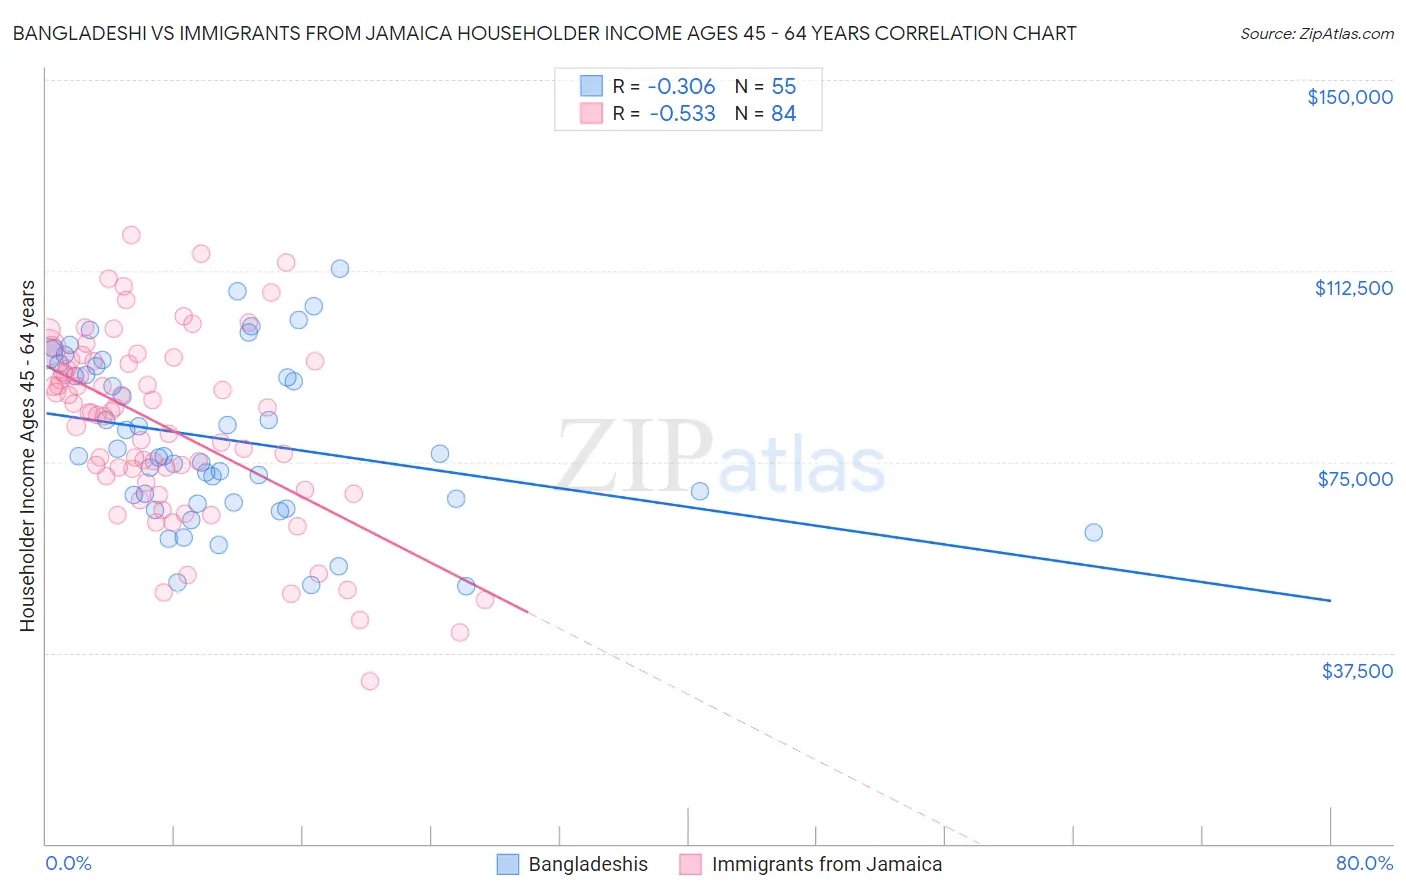
Bangladeshi vs Immigrants from Jamaica Householder Income Ages 45 - 64 years Correlation Chart
The statistical analysis conducted on geographies consisting of 141,236,471 people shows a mild negative correlation between the proportion of Bangladeshis and household income with householder between the ages 45 and 64 in the United States with a correlation coefficient (R) of -0.306 and weighted average of $86,402. Similarly, the statistical analysis conducted on geographies consisting of 301,245,641 people shows a substantial negative correlation between the proportion of Immigrants from Jamaica and household income with householder between the ages 45 and 64 in the United States with a correlation coefficient (R) of -0.533 and weighted average of $87,035, a difference of 0.73%.
Householder Income Ages 45 - 64 years Correlation Summary
| Measurement | Bangladeshi | Immigrants from Jamaica |
| Minimum | $50,598 | $31,923 |
| Maximum | $113,000 | $119,503 |
| Range | $62,402 | $87,580 |
| Mean | $79,486 | $82,100 |
| Median | $76,107 | $84,769 |
| Interquartile 25% (IQ1) | $66,969 | $71,502 |
| Interquartile 75% (IQ3) | $93,746 | $94,805 |
| Interquartile Range (IQR) | $26,777 | $23,303 |
| Standard Deviation (Sample) | $15,976 | $18,162 |
| Standard Deviation (Population) | $15,831 | $18,054 |
Demographics Similar to Bangladeshis and Immigrants from Jamaica by Householder Income Ages 45 - 64 years
In terms of householder income ages 45 - 64 years, the demographic groups most similar to Bangladeshis are Immigrants from St. Vincent and the Grenadines ($86,394, a difference of 0.010%), Cuban ($86,301, a difference of 0.12%), Immigrants from Guatemala ($86,573, a difference of 0.20%), Blackfeet ($86,595, a difference of 0.22%), and Cherokee ($86,125, a difference of 0.32%). Similarly, the demographic groups most similar to Immigrants from Jamaica are Yakama ($86,992, a difference of 0.050%), Immigrants from Somalia ($86,987, a difference of 0.050%), Yaqui ($86,914, a difference of 0.14%), Senegalese ($86,897, a difference of 0.16%), and Cree ($87,185, a difference of 0.17%).
| Demographics | Rating | Rank | Householder Income Ages 45 - 64 years |
| Cape Verdeans | 0.2 /100 | #272 | Tragic $87,580 |
| Spanish American Indians | 0.2 /100 | #273 | Tragic $87,561 |
| Iroquois | 0.1 /100 | #274 | Tragic $87,255 |
| Immigrants | Belize | 0.1 /100 | #275 | Tragic $87,229 |
| Immigrants | Latin America | 0.1 /100 | #276 | Tragic $87,219 |
| Cree | 0.1 /100 | #277 | Tragic $87,185 |
| Immigrants | Jamaica | 0.1 /100 | #278 | Tragic $87,035 |
| Yakama | 0.1 /100 | #279 | Tragic $86,992 |
| Immigrants | Somalia | 0.1 /100 | #280 | Tragic $86,987 |
| Yaqui | 0.1 /100 | #281 | Tragic $86,914 |
| Senegalese | 0.1 /100 | #282 | Tragic $86,897 |
| Mexicans | 0.1 /100 | #283 | Tragic $86,816 |
| Central American Indians | 0.1 /100 | #284 | Tragic $86,764 |
| Blackfeet | 0.1 /100 | #285 | Tragic $86,595 |
| Immigrants | Guatemala | 0.1 /100 | #286 | Tragic $86,573 |
| Bangladeshis | 0.1 /100 | #287 | Tragic $86,402 |
| Immigrants | St. Vincent and the Grenadines | 0.1 /100 | #288 | Tragic $86,394 |
| Cubans | 0.1 /100 | #289 | Tragic $86,301 |
| Cherokee | 0.1 /100 | #290 | Tragic $86,125 |
| Hispanics or Latinos | 0.1 /100 | #291 | Tragic $86,006 |
| Immigrants | Central America | 0.1 /100 | #292 | Tragic $85,965 |