Bangladeshi vs Estonian In Labor Force | Age > 16
COMPARE
Bangladeshi
Estonian
In Labor Force | Age > 16
In Labor Force | Age > 16 Comparison
Bangladeshis
Estonians
65.9%
IN LABOR FORCE | AGE > 16
98.9/ 100
METRIC RATING
96th/ 347
METRIC RANK
64.8%
IN LABOR FORCE | AGE > 16
13.1/ 100
METRIC RATING
214th/ 347
METRIC RANK
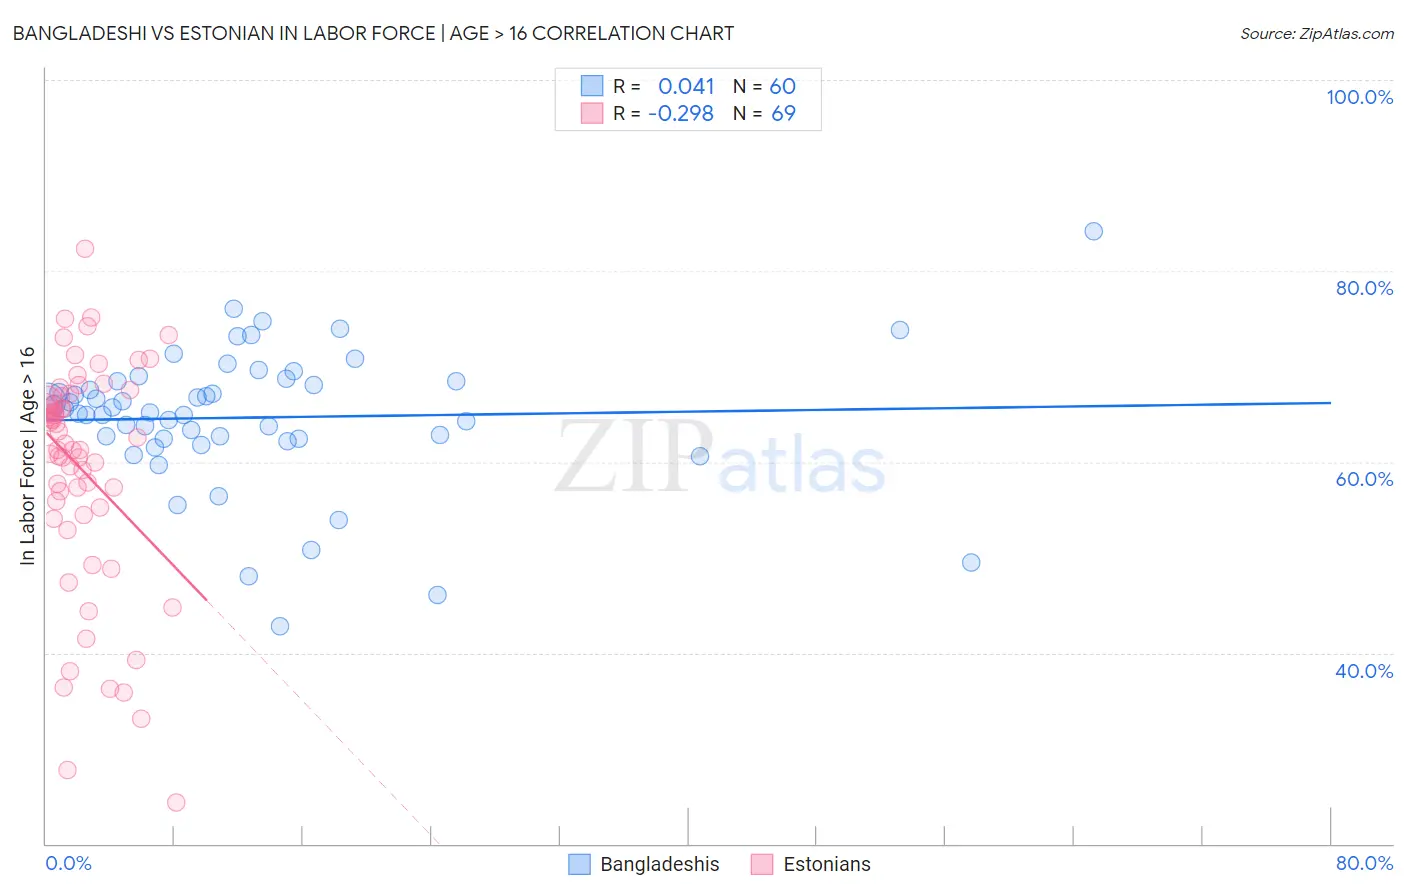
Bangladeshi vs Estonian In Labor Force | Age > 16 Correlation Chart
The statistical analysis conducted on geographies consisting of 141,452,926 people shows no correlation between the proportion of Bangladeshis and labor force participation rate among population ages 16 and over in the United States with a correlation coefficient (R) of 0.041 and weighted average of 65.9%. Similarly, the statistical analysis conducted on geographies consisting of 123,528,478 people shows a weak negative correlation between the proportion of Estonians and labor force participation rate among population ages 16 and over in the United States with a correlation coefficient (R) of -0.298 and weighted average of 64.8%, a difference of 1.8%.
In Labor Force | Age > 16 Correlation Summary
| Measurement | Bangladeshi | Estonian |
| Minimum | 42.8% | 24.3% |
| Maximum | 84.1% | 82.3% |
| Range | 41.3% | 58.0% |
| Mean | 64.7% | 59.2% |
| Median | 65.3% | 61.9% |
| Interquartile 25% (IQ1) | 62.4% | 54.8% |
| Interquartile 75% (IQ3) | 68.4% | 66.6% |
| Interquartile Range (IQR) | 6.0% | 11.7% |
| Standard Deviation (Sample) | 7.3% | 12.0% |
| Standard Deviation (Population) | 7.2% | 11.9% |
Similar Demographics by In Labor Force | Age > 16
Demographics Similar to Bangladeshis by In Labor Force | Age > 16
In terms of in labor force | age > 16, the demographic groups most similar to Bangladeshis are Filipino (65.9%, a difference of 0.010%), Immigrants from Uruguay (66.0%, a difference of 0.040%), Immigrants from Chile (65.9%, a difference of 0.040%), Immigrants from Cambodia (66.0%, a difference of 0.050%), and Immigrants from South America (66.0%, a difference of 0.060%).
| Demographics | Rating | Rank | In Labor Force | Age > 16 |
| Immigrants | Laos | 99.2 /100 | #89 | Exceptional 66.0% |
| Chileans | 99.2 /100 | #90 | Exceptional 66.0% |
| Iranians | 99.2 /100 | #91 | Exceptional 66.0% |
| Aleuts | 99.1 /100 | #92 | Exceptional 66.0% |
| Immigrants | South America | 99.1 /100 | #93 | Exceptional 66.0% |
| Immigrants | Cambodia | 99.1 /100 | #94 | Exceptional 66.0% |
| Immigrants | Uruguay | 99.1 /100 | #95 | Exceptional 66.0% |
| Bangladeshis | 98.9 /100 | #96 | Exceptional 65.9% |
| Filipinos | 98.9 /100 | #97 | Exceptional 65.9% |
| Immigrants | Chile | 98.7 /100 | #98 | Exceptional 65.9% |
| Immigrants | Australia | 98.7 /100 | #99 | Exceptional 65.9% |
| Okinawans | 98.7 /100 | #100 | Exceptional 65.9% |
| Immigrants | Colombia | 98.6 /100 | #101 | Exceptional 65.9% |
| Uruguayans | 98.6 /100 | #102 | Exceptional 65.9% |
| Immigrants | South Eastern Asia | 98.5 /100 | #103 | Exceptional 65.9% |
Demographics Similar to Estonians by In Labor Force | Age > 16
In terms of in labor force | age > 16, the demographic groups most similar to Estonians are Fijian (64.8%, a difference of 0.020%), Alaskan Athabascan (64.8%, a difference of 0.020%), Maltese (64.8%, a difference of 0.020%), Immigrants from Czechoslovakia (64.8%, a difference of 0.020%), and Immigrants from Denmark (64.8%, a difference of 0.040%).
| Demographics | Rating | Rank | In Labor Force | Age > 16 |
| Immigrants | Latin America | 16.4 /100 | #207 | Poor 64.8% |
| Belizeans | 16.2 /100 | #208 | Poor 64.8% |
| Immigrants | Trinidad and Tobago | 15.6 /100 | #209 | Poor 64.8% |
| Immigrants | Denmark | 14.7 /100 | #210 | Poor 64.8% |
| Fijians | 14.1 /100 | #211 | Poor 64.8% |
| Alaskan Athabascans | 13.9 /100 | #212 | Poor 64.8% |
| Maltese | 13.8 /100 | #213 | Poor 64.8% |
| Estonians | 13.1 /100 | #214 | Poor 64.8% |
| Immigrants | Czechoslovakia | 12.3 /100 | #215 | Poor 64.8% |
| Belgians | 11.4 /100 | #216 | Poor 64.7% |
| U.S. Virgin Islanders | 11.3 /100 | #217 | Poor 64.7% |
| Alsatians | 10.7 /100 | #218 | Poor 64.7% |
| Immigrants | Central America | 10.5 /100 | #219 | Poor 64.7% |
| Alaska Natives | 9.9 /100 | #220 | Tragic 64.7% |
| Immigrants | Micronesia | 9.6 /100 | #221 | Tragic 64.7% |