Bangladeshi vs Estonian Unemployment Among Women with Children Under 18 years
COMPARE
Bangladeshi
Estonian
Unemployment Among Women with Children Under 18 years
Unemployment Among Women with Children Under 18 years Comparison
Bangladeshis
Estonians
5.3%
UNEMPLOYMENT AMONG WOMEN WITH CHILDREN UNDER 18 YEARS
73.2/ 100
METRIC RATING
147th/ 347
METRIC RANK
5.1%
UNEMPLOYMENT AMONG WOMEN WITH CHILDREN UNDER 18 YEARS
97.2/ 100
METRIC RATING
64th/ 347
METRIC RANK
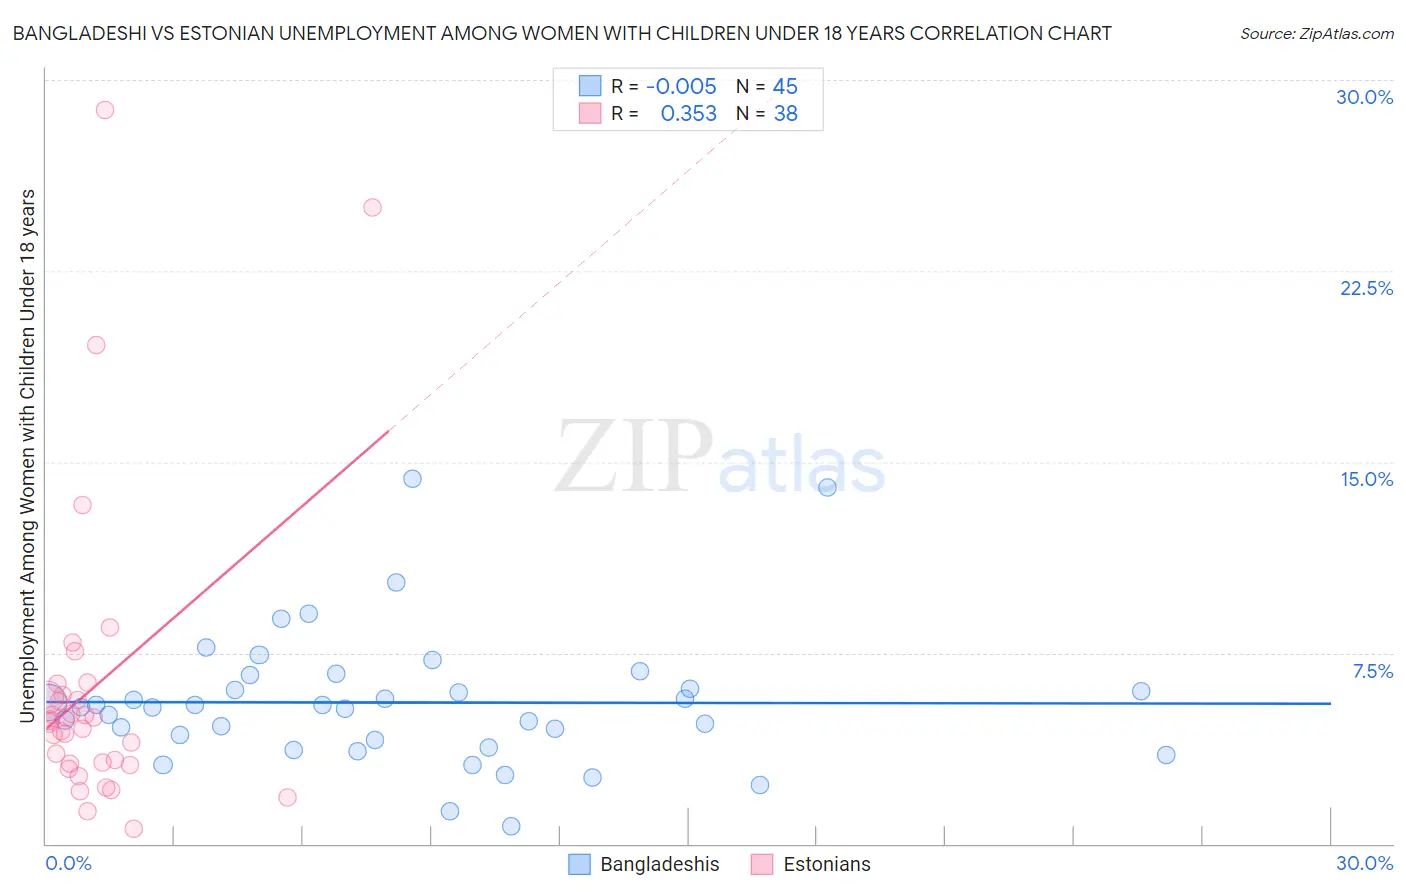
Bangladeshi vs Estonian Unemployment Among Women with Children Under 18 years Correlation Chart
The statistical analysis conducted on geographies consisting of 138,843,542 people shows no correlation between the proportion of Bangladeshis and unemployment rate among women with children under the age of 18 in the United States with a correlation coefficient (R) of -0.005 and weighted average of 5.3%. Similarly, the statistical analysis conducted on geographies consisting of 121,191,816 people shows a mild positive correlation between the proportion of Estonians and unemployment rate among women with children under the age of 18 in the United States with a correlation coefficient (R) of 0.353 and weighted average of 5.1%, a difference of 4.8%.
Unemployment Among Women with Children Under 18 years Correlation Summary
| Measurement | Bangladeshi | Estonian |
| Minimum | 0.70% | 0.60% |
| Maximum | 14.4% | 28.8% |
| Range | 13.7% | 28.2% |
| Mean | 5.5% | 6.2% |
| Median | 5.4% | 4.8% |
| Interquartile 25% (IQ1) | 3.9% | 3.2% |
| Interquartile 75% (IQ3) | 6.4% | 5.8% |
| Interquartile Range (IQR) | 2.4% | 2.7% |
| Standard Deviation (Sample) | 2.7% | 6.0% |
| Standard Deviation (Population) | 2.6% | 5.9% |
Similar Demographics by Unemployment Among Women with Children Under 18 years
Demographics Similar to Bangladeshis by Unemployment Among Women with Children Under 18 years
In terms of unemployment among women with children under 18 years, the demographic groups most similar to Bangladeshis are Immigrants from Belarus (5.3%, a difference of 0.020%), Immigrants from Western Europe (5.4%, a difference of 0.030%), Immigrants from Egypt (5.3%, a difference of 0.070%), Immigrants from Kenya (5.4%, a difference of 0.090%), and Immigrants from Argentina (5.4%, a difference of 0.13%).
| Demographics | Rating | Rank | Unemployment Among Women with Children Under 18 years |
| Immigrants | Norway | 76.2 /100 | #140 | Good 5.3% |
| Venezuelans | 76.0 /100 | #141 | Good 5.3% |
| Immigrants | Venezuela | 75.4 /100 | #142 | Good 5.3% |
| Chileans | 75.0 /100 | #143 | Good 5.3% |
| Immigrants | England | 74.9 /100 | #144 | Good 5.3% |
| Immigrants | Egypt | 74.0 /100 | #145 | Good 5.3% |
| Immigrants | Belarus | 73.4 /100 | #146 | Good 5.3% |
| Bangladeshis | 73.2 /100 | #147 | Good 5.3% |
| Immigrants | Western Europe | 72.8 /100 | #148 | Good 5.4% |
| Immigrants | Kenya | 72.2 /100 | #149 | Good 5.4% |
| Immigrants | Argentina | 71.7 /100 | #150 | Good 5.4% |
| Immigrants | Iran | 71.1 /100 | #151 | Good 5.4% |
| Immigrants | South Eastern Asia | 71.1 /100 | #152 | Good 5.4% |
| Carpatho Rusyns | 70.8 /100 | #153 | Good 5.4% |
| Immigrants | Latvia | 70.8 /100 | #154 | Good 5.4% |
Demographics Similar to Estonians by Unemployment Among Women with Children Under 18 years
In terms of unemployment among women with children under 18 years, the demographic groups most similar to Estonians are Immigrants from Sweden (5.1%, a difference of 0.020%), Immigrants from Australia (5.1%, a difference of 0.12%), Fijian (5.1%, a difference of 0.14%), Italian (5.1%, a difference of 0.17%), and Immigrants from Bulgaria (5.1%, a difference of 0.19%).
| Demographics | Rating | Rank | Unemployment Among Women with Children Under 18 years |
| Czechoslovakians | 98.0 /100 | #57 | Exceptional 5.1% |
| Immigrants | Belgium | 97.9 /100 | #58 | Exceptional 5.1% |
| Asians | 97.9 /100 | #59 | Exceptional 5.1% |
| Welsh | 97.7 /100 | #60 | Exceptional 5.1% |
| Russians | 97.5 /100 | #61 | Exceptional 5.1% |
| Immigrants | Bulgaria | 97.4 /100 | #62 | Exceptional 5.1% |
| Italians | 97.4 /100 | #63 | Exceptional 5.1% |
| Estonians | 97.2 /100 | #64 | Exceptional 5.1% |
| Immigrants | Sweden | 97.1 /100 | #65 | Exceptional 5.1% |
| Immigrants | Australia | 97.0 /100 | #66 | Exceptional 5.1% |
| Fijians | 96.9 /100 | #67 | Exceptional 5.1% |
| Irish | 96.8 /100 | #68 | Exceptional 5.1% |
| Austrians | 96.6 /100 | #69 | Exceptional 5.1% |
| Icelanders | 96.6 /100 | #70 | Exceptional 5.1% |
| Serbians | 96.5 /100 | #71 | Exceptional 5.1% |